If you want to compete in the modern sales world, your team and your strategy must track sales performance metrics that drive success for your organization. Power your team with data, and you’ll bring instant alignment to the sales floor — because everyone will know exactly where they stand and what’s expected of them.
Plus, you’ll be able to set the right goals, hold people accountable to their numbers, and know how and when to course-correct if your team is headed off track.
That level of transparency is a crazy-effective motivator. In fact, according to our State of Sales Performance Report, 32% of reps said that visibility into numbers gets them more fired up to sell than anything else (including awards programs!).
Which makes it all the more puzzling that — according to the same survey — over 30% of reps don’t get visibility into their performance on a daily basis. Yikes! That’s a whole lot of people who are working in the dark, hoping that all of the calls and meetings are somehow moving the needle.
What Are Sales Metrics and Sales KPIs?
Sales metrics are data that track a company’s sales performance. They can measure the activity of your reps, the number and quality of deals, or the revenue you’re generating. They can be used to set strategy, identify current performance, or track problems in the pipeline.
The words “metric” and “KPI” are often used interchangeably, but in general, a KPI can be defined as a metric which has been identified as one of the most important for measuring business success, and can therefore be used to track overall performance.
Sales metrics are important, but it’s up to you to determine which ones are true measures of performance — i.e., which numbers, as they change, are ultimately tied to more deals closed, and more revenue won?
Those are your sales KPIs — the numbers that actually move the needle for you. And if you truly want to be a metric-driven team, those are the metrics that you must build your entire sales strategy around.
Teams need to define their own KPIs. We can’t tell you which ones to use. This is because every business is unique. Only you know which numbers are really the best indicators of whether you’re successful or not.
One thing we can say is that a good KPI dashboard is likely to include a mix of “lead” indicators, which tell you whether you’re likely to be on track to hit your targets, and “lag” indicators, which tell you whether you actually did.
How Do You Measure Sales Performance?
First, let’s have a look at definitions for some of the most important metrics you can use to set targets for your business, why they matter, and how to calculate them. Some of them look at revenue and profit in the business. Others are used for tracking sales performance for your reps. Any might be a KPI for your business.
Then we’ll have a look at how you might understand the sort of metrics you should be tracking, and how to use them.
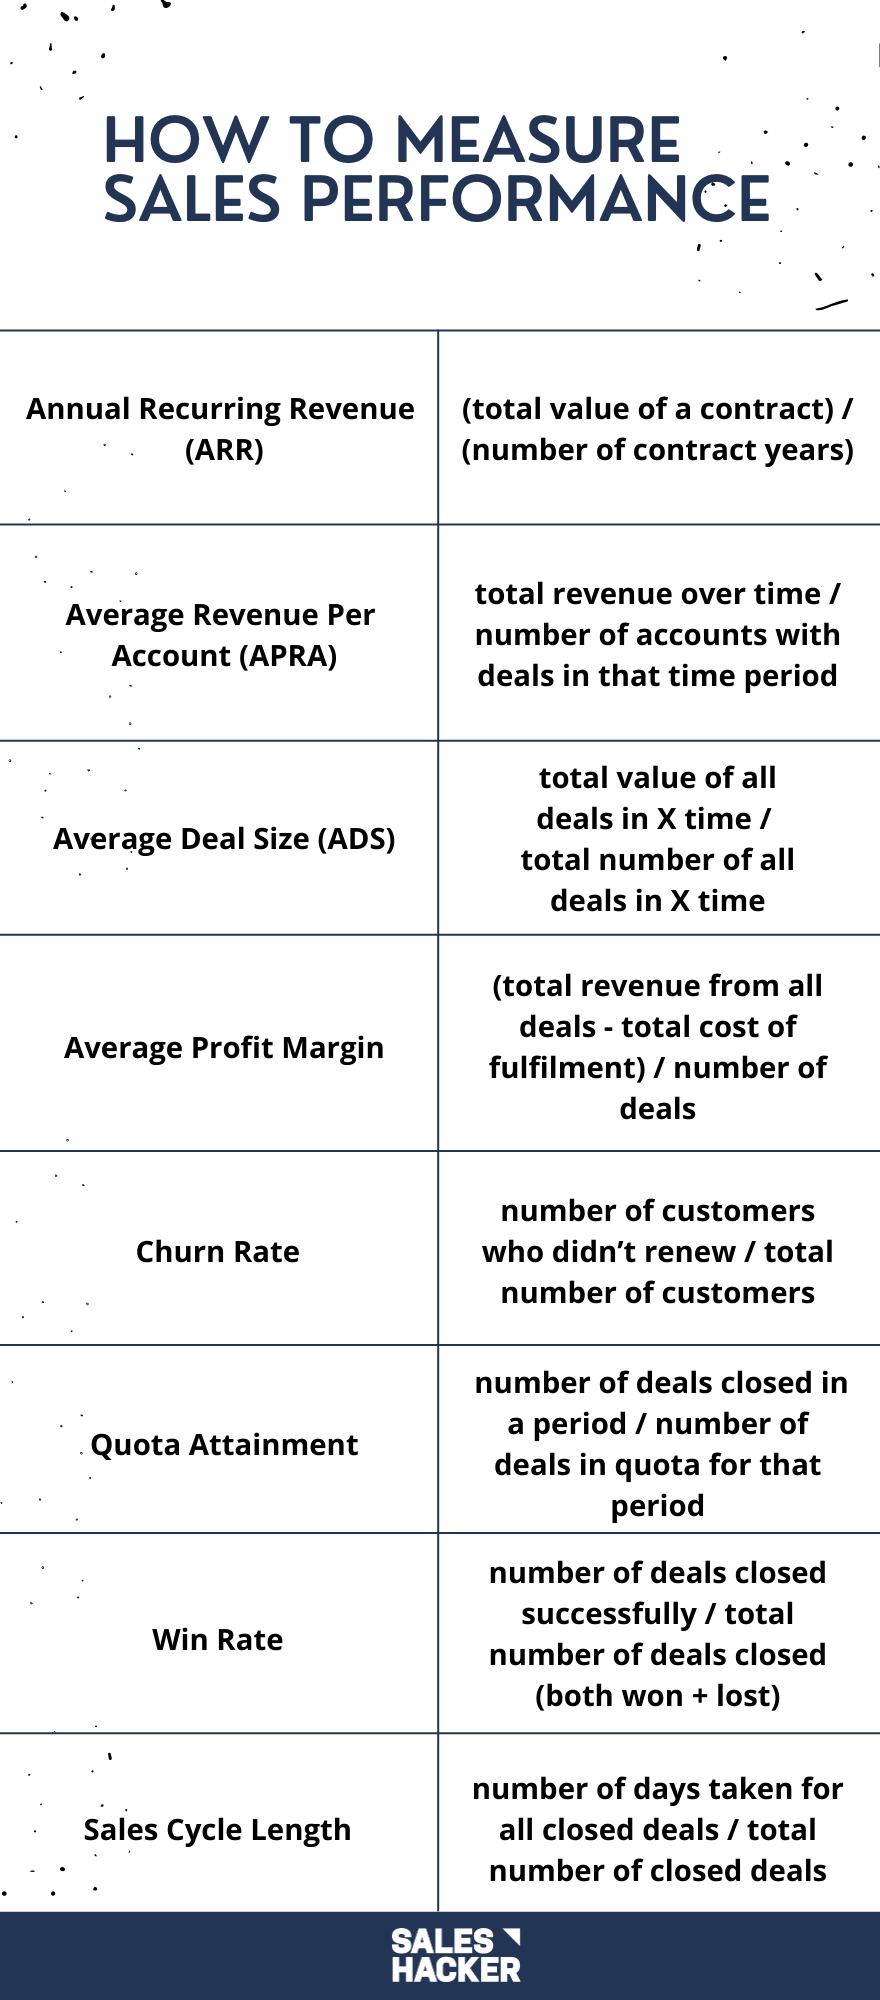
1. Annual Recurring Revenue (ARR)
This is often a key sales performance metric, particularly for a software-as-a-service business. It’s the total value of contracted revenue that your company brings in each year. It’s calculated by taking the total value of a contract, divided by the number of years it has left to run. For a company, it’s the value of all contracts divided by the number of years left on them.
Annual recurring revenue (ARR) = (total value of a contract) / (number of contract years)
2. Average Revenue Per Account
ARPA is the measure of the value of each account. It’s important to calculate this so that the company knows how much each deal has historically been worth, and is likely to be worth in the future. It gives staff a benchmark to measure a deal against, and if it falls or rises significantly over time that’s a flag that something’s up. Identifying high ARPA accounts may give you a good sense of where to focus your efforts in future.
APRA = (total revenue over time) / (number of accounts with deals in that time period)
3. Average Deal Size
Average deal size is exactly what it sounds like. If your team closes half a dozen deals during a given period, average how much they’re worth, and that gives you the ADS. It’s similar to ARPA, but it looks only at new deals, not all accounts.
It ADS is going up faster that the real economy, it means you’re landing bigger deals, with bigger clients. But be careful. ADS can be very lumpy and needs to be smoothed and tracked over long periods of time.
Average deal size = (total value of all deals in X time) / (total number of all deals in X time)
4. Average Profit Margin
It’s easy to look at revenue from deals and judge the success of the sales team on that. But revenue’s vanity. Profit is sanity. The real question is the margin on each deal. What does it look like after all of your costs, and all of the costs of actually delivering? If you’re working in a field like SaaS, this may not be such a big issue. So many of the costs are in product development that the marginal profit on each sale might be 70 or 80 per cent.
Average profit margin = (total revenue from all deals – total cost of fulfillment) / number of deals
5. Churn Rate
The churn rate is the number of customers who don’t renew their contract during a period.
Technically this is the gross churn rate, which simply counts the percentage of existing customers who don’t renew. A separate number, net churn, counts lost customers against new revenue, and is often negative.
Churn is important because it indicates whether you’re putting enough resources into retention and you’re delivering a quality service. It’s many, many times cheaper to retain an existing customer than acquire a new one, so each lost account means more effort for your sales team.
Churn rate = (number of customers who didn’t renew) / (total number of customers)
6. Quota Attainment
This sales performance metric is one of several measures of how well your reps are performing, and it simply looks at whether they are meeting the number of deals that’s been set for them. Obviously if any rep is consistently underperforming this number, that will need review. If your reps in general are missing quota over a lengthy period, then either there are significant problems in the business, or target setting needs review.
Quota attainment = (number of deals closed in a period) / (number of deals in quota for that period)
7. Win Rate
This is another figure that tracks how your reps are doing. It looks at the number of deals they closed successfully, against the number of deals which were moved off your books during the period – either because they closed successfully or because there was no sale and no activity – they were closed lost, in other words.
You need to know the win rate to know how many deals you need in your pipeline. If it’s rising or falling over time, it tells you something important about whether you’re doing a good job of closing deals.
Win rate = (number of deals closed successfully) / (total number of deals closed – both won + lost)
8. Sales Cycle Length
This refers to the length of time it takes a customer to move from a qualified opportunity to a closed deal. Once again, if it materially changes, this suggests there is some element of risk in the sales process. It also lets you spot deals which have gone much longer than normal without being closed, which are more likely to be at risk of falling through.
Sales cycle length = (number of days taken for all closed deals) / t(otal number of closed deals)
6 Steps to Develop Your Own Sales Performance Metrics and KPIs
Here are 6 steps to ensuring you’ve got a successful sales metrics definition and strategy in place — built around the sales KPIs that matter most — so your whole team can hit (or exceed!) your ultimate revenue target.
- Understand the sales metrics you need to track
- Identify your sales KPIs
- Set the right goals
- Build your scorecard
- Stay accountable
- Coach your team to success
1. Understand What Types of Sales Metrics You Should Be Tracking
There are three types of performance metrics you should be working toward: Activity metrics, Objective metrics, and Moneyball (effectiveness) metrics. Now, let’s take a look at each.
Activity sales metrics are where the hustle lives. This is the daily grind that your sales reps live and breathe every day, whether it’s picking up the phone, meeting with clients, or messaging prospects on LinkedIn. Typically, you need to measure the quantity of these activities:
- How many calls are they making in a week?
- How many calls are they making in a month?
Objective sales metrics are the longer-term outcomes that all of those activities help create. These are metrics like…
- Revenue
- Profit
- Leads converted
- Closed/won deals
… which all add up to your overall priority metrics (or North Star number — more on that in a bit).
Moneyball sales metrics add critical value for sales coaches and GMs looking to assess, align, and optimize their teams as efficiently as possible. This measures the effectiveness and efficiency of the various activities your reps are performing; think of them as conversion points.
- How many calls turned into conversations?
- How many of those conversations turned into scheduled meetings?
- Focusing on the conversion rate helps your sales reps see where their skill and strategy come into play and how that impacts their bottom line.
Examples of Key Sales Metrics to Track
Most sales teams track the number of scheduled meetings or calls, but that’s just the start. What you really want to know is: Did the meeting result in the next step in the sales process?
Here are four sales performance metrics you may not be tracking, but you should:
Conversations – Dials are incredibly important — but are those calls effective? How often are your team members connecting, and many conversations are they having?
Talk Time – Optimizing each conversation length can help you see where things are going well and where they might go awry. Understanding a typical conversation length for a given type of conversation can give you another indication of the quality and skill of your sales reps.
Positive Disposition Calls – Of those conversations, how did the prospect react? It’s extremely useful to know what percentage of conversations had positive or negative sentiment. Did the prospect schedule a next step?
If a rep is having a lot of conversations that stop short by a prospect responding, “I’m not the one to make this decision,” or “I’m not interested,” it might be time to re-evaluate your qualification process. Sentiment gives us some detail on how effective the person’s skills are around running a product demo or qualification call.
Rate of Progress – A sales rep can only schedule so many meetings per week or per month. How fast can they move those prospects into a positive next step? Rather than focusing on having ten meetings in a week, focus on the conversion rate to the next opportunity stage.
Once you see how a group of 4, 8, or 50 salespeople move leads through the sales process, you can determine where and how to coach them when they get stuck.
Related: Sales Metrics 101: How to Find and Fix Those Dangerous Cracks in Your Sales Funnel
2. Identify Your Team KPIs
Most reps and sales leaders think top sales KPIs are Revenue Generated, Pipeline Generated, and Opportunities Created, according to our State of Sales Performance Survey.
But this doesn’t tell the full story, because if you’re only paying attention to your end goal, you won’t find out whether you hit it until it’s too late. You must have a full understanding (and keep track of) the daily activities that lead up to that final objective.
To identify your team KPIs:
Step 1: Start With Your North Star Number(s)
How do you make sure you’ve got the right sales KPIs on your radar? Well, first determine where you’ve got to get to. For most sales teams, that’s the ultimate revenue goal for the sales organization. This is the number your team is trying to hit as a unit, and it can be a quarterly or annual number.
So if the goal of your organization is to generate $20m a year in revenue, and all of it is coming from sales, that’s your North Star. Achieve that and you’ve succeeded. Miss it and you’ve failed. Every other number that you look at should be a tool to help you work out whether you’re on track to reach that North Star Number.
Step 2: Work Backwards to Define Opportunity Stages
Once you know your North Star Number(s), work backward to define the opportunity stages that align with your revenue goal. This is the only way to figure out what actions will get you to the raw dollar number that is your Revenue North Star.
If you know your average deal value, you’ll know how many deals you have to do, in order to hit your North Star Number.
If you know how many deals you need in the pipeline to close that number of deals, and the number of prospects you need to identify to get that level of pipeline, you can identify the amount of activity needed from each part of the business to hit your North Star. (More on this below.)
Working backward allows you to identify the lagging indicators that are directly (or indirectly) tied to getting closed/won deals.
Step 3: Calculate Your Conversion Rates Between Stages
From there, continue to break down each opportunity stage to define the activities that drive conversion between the stages (hint: these are your Moneyball metrics).
Using historical numbers, figure out the average conversion rate between stages in the pipeline and see where you’re doing well or could improve. The biggest thing to remember? Don’t let historical conversion rates or achievement limit your ambition.
Step 4: Define the Activities That Drive Conversion
What gives someone the right nudge to move forward in the sales process? Your next step is to learn which activities help deals progress through each stage of your sales funnel. These are the activities you should measure and reinforce for reps.
Understanding how each activity converts is critical. Many sales leaders track dials because they’re supposed to — but in some markets, that may not be the most effective activity.
So do some light math:
- What percentage of calls lead to the next step in the process?
- How does that compare to the percentage of emails that lead to the next step?
Getting scientific makes it easy to focus on the right behaviors — no guesswork required! — and keeps you from spending time on the ones that actually aren’t doing a whole lot for your team.
A key facet of sales to remember: You can only manage what you can control. And activity and effort are two things that are fully under your control. Which brings us to…
3. Set the Right Goals
Set goals that are based on the relevant activities you determined in Step 2 to achieve the sales performance metrics and KPIs you’ve set for yourself. This will create a system of consistency and accountability that will make your reps successful.
Of course, meeting a goal is always easier said than done. But a good goal should require a little bit of hustle — no one ever said that sales was easy.
Sales goals should always be S.M.A.R.T. By that, I mean:
- Specific
- Measurable
- Achievable
- Relevant
- Time-Bound
The S.M.A.R.T framework helps you convert your key activity and conversion sales metrics (from step two above) into sales KPIs.
Here’s how to set your S.M.A.R.T goals:
First, work backward from “the Number” for the quarter or year. If you’re looking at $5 million in new sales, break that into more digestible chunks with shorter timelines. If your average sale is $100,000, then you need to close 50 sales in a year to reach $5 million. And if you win 25% of the time, then that means you need 200 opportunities in your pipeline.
From there, determine which activities you need to do to move your pipeline forward. How many positive conversations does it take to create an opportunity?
Once you look at the whole process from the ultimate end result and you know how to get there…
Set a specific, distinct number as the S.M.A.R.T goal for each rep and for each team. For example, a S.M.A.R.T goal to set for each sales rep might be 50 outbound dials per day. That particular metric works because it’s:
- Specific (50 outbound dials)
- Measurable (easily tracked through CRM)
- Achievable (about one dial every 10 minutes in an 8-hour workday)
- Relevant (this is a key activity to start moving prospects through the pipeline)
- Time-bound (per day)
You’ll know you’ve chosen the right S.M.A.R.T goals if they are challenging but achievable, and most importantly, keep the team accountable and aligned to the greater sales strategy.
Related: The Scientific Approach to Setting Sales Goals for Your SDR Team [Template Included]
4. Build Your Scorecard
Once you know which metrics matter and you’ve chosen the right goals, it’s imperative that you reflect all of this in an individual sales scorecard for every rep on your team. Scorecards should be clear, structured, and easily accessible so that your reps always know where they stand, how they’re performing, and where they need to improve.
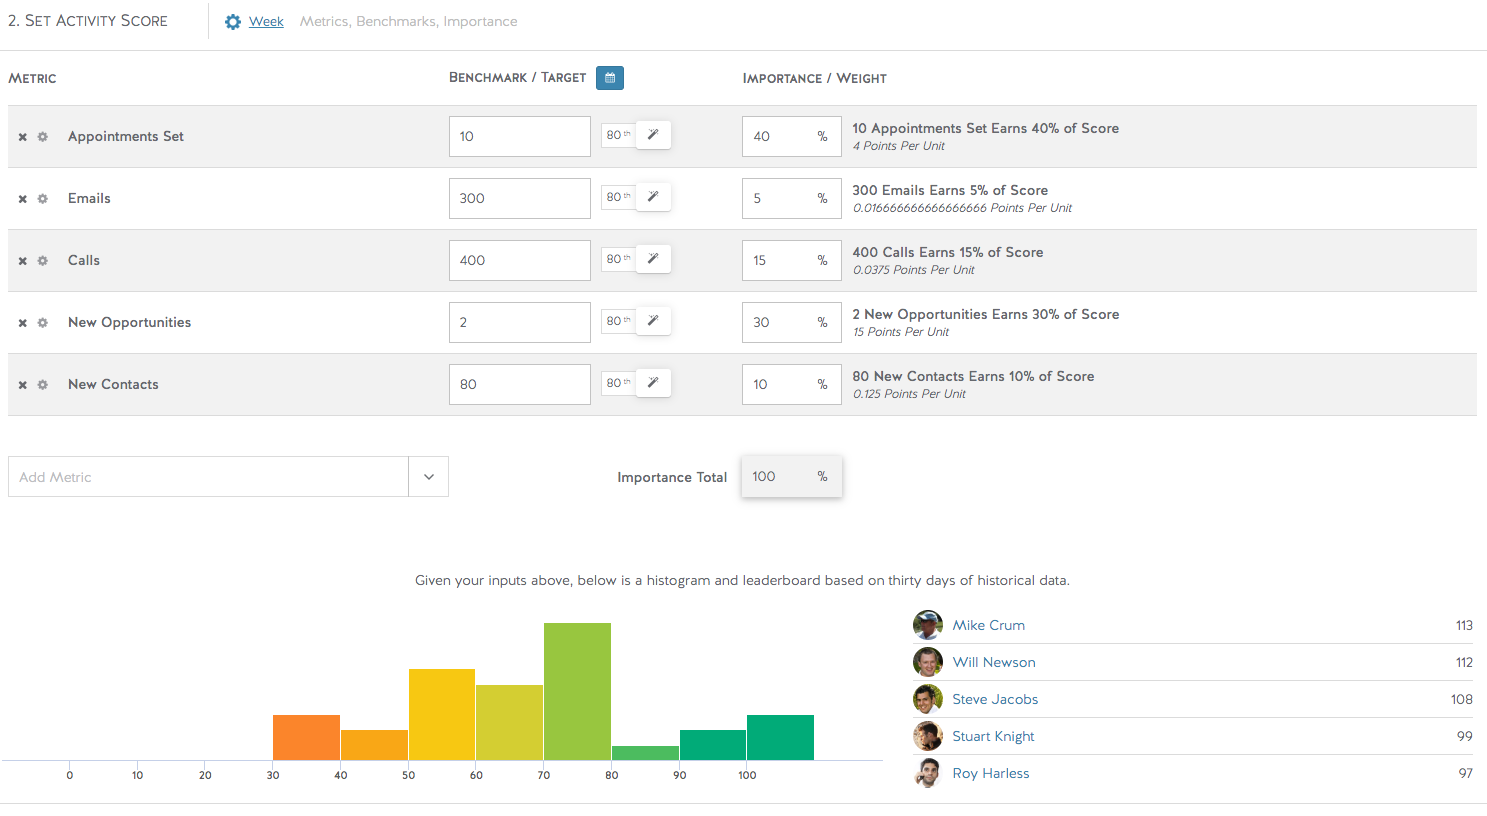
A good sales scorecard has two sections:
- Activities: these are the day-to-day activities that lead to closed deals, like emails or calls.
- Objectives: these are the results achieved over a certain period of time (month/quarter), such as won opportunities or revenue.
Both sections should include a way to record:
- Metrics: the individual actions that are being measured
- Benchmarks: the target or goal for each type of metric
- Weights: the established value or importance of each benchmark
In the example below, you can see every Activity Metric — appointments set, emails, calls, etc. — has its own benchmark or target, which is weighted according to its importance. In this example, “new opportunities” carry the most value toward revenue and are therefore weighted heaviest, at 15 points per unit.
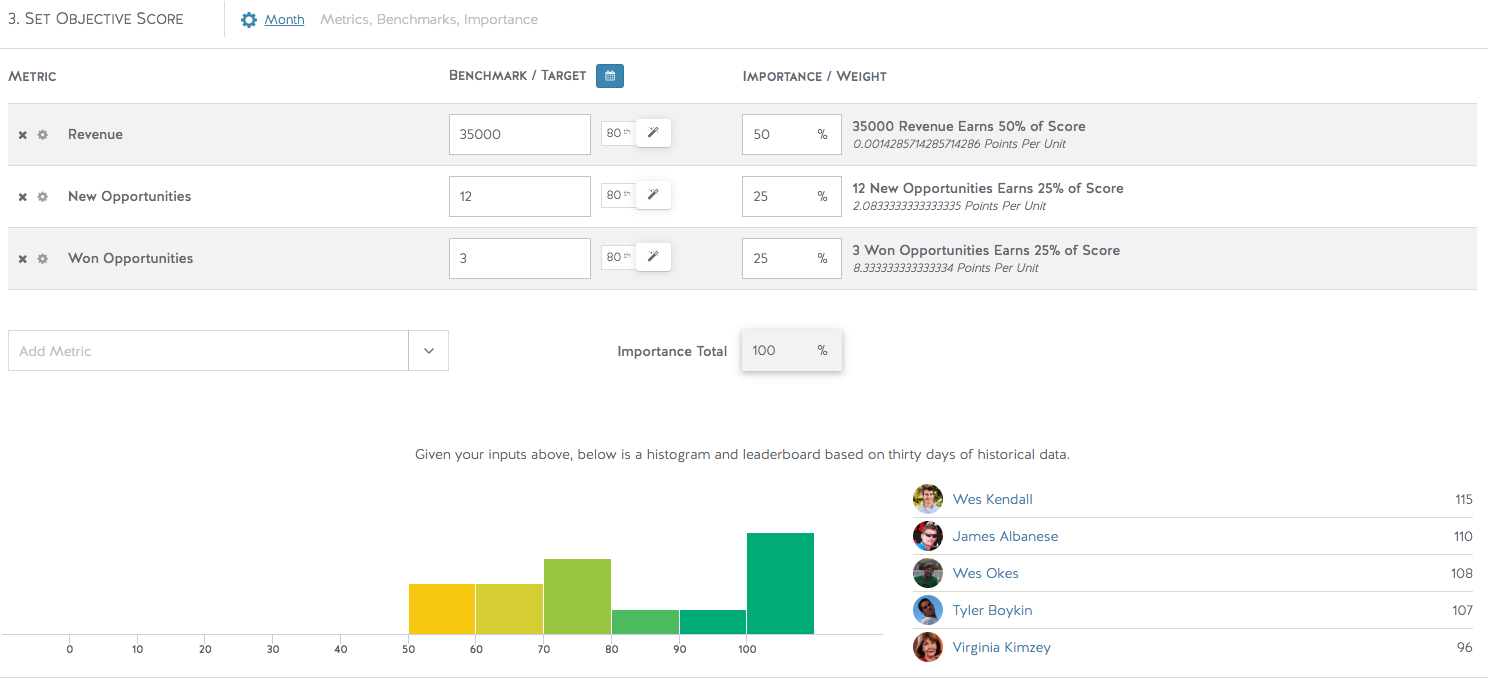
Similarly, the Objective Metrics are benchmarked and weighted according to their importance. Notice that “new opportunities” is a metric in this section as well, but it’s weighted heavier in the Activity Score section than it is here.
That’s because, while new opportunities are an indicator that a lead is moving down the funnel, it’s not as indicative of long-term success (i.e., over a month or quarter) as are “won opportunities” or “revenue.”
5. Stay Accountable with Visibility and Excitement
For sales reps, reaching (and exceeding) the goals you’ve set starts with understanding how daily behavior and KPI accountability aligns to the organizational goals.
The most important way you can motivate your team is to give them this understanding.
Mentally, your team members want to be part of something bigger, not just some cog in the “sales machine.” Knowing what they’re contributing — and what that means on a daily and weekly basis to succeed — will help your whole team hit the goal together.
The key?
Make sure these goals are visible. The more you talk about your metrics, the more your sales reps can internalize how they are performing and where that fits into the team’s progress as a whole.
It can be as simple as a dashboard that everyone can access. Tracking and publicizing progress creates both positive reinforcement and feedback loops for your team.
Of course, “real time” is key here. No one appreciates finding out they aren’t going to hit their numbers with only a few weeks left in the quarter. If those insights aren’t delivered on a continual basis, they’re far less useful — because there’s no room left to double down on what’s working or course-correct as needed.
You’re all moving together toward the same goal. To really perform, individual reps need to understand how they’re progressing toward their goals, how they compare to their peers, and then how they’re delivering value to the company.
6. Coach Your Team to Success
KPIs and coaching go hand-in-hand. The most important thing as a manager is to have empathy for each individual member of the team.
It’s not about coaching them up because it’s what you need or what the business needs. They’re working for you because they want to accomplish something. Being a great leader means understanding what that is— whether it’s a monetary goal, eye on a promotion, or something else — and using sales metrics to guide them to that goal.
Identifying the right sales metrics and KPIs
When you identify the right sales performance metrics and KPIs, you create consistency and focus for your team, and you level the playing field so you all move together.
If there are gaps in performance, it’s your job as a leader to say, “How do I help?”
You may need to pair a rep with another, more successful rep who can serve as a mentor or work with them 1:1 with role-playing.
Maybe there’s another impediment you don’t know about. You need to search for those things — and ask your team what they need. Whatever the case may be, make sure you’re on the same side of the table, working together.
Talk to your team about sales performance
KPIs help you tell the story of what’s going on and what happened. When it comes to your 1:1s, performance should never come as a surprise. And your KPIs should not just be a random number that has no context.
Every conversation should be grounded in the sales metrics you’ve prioritized, the sales KPIs you’re targeting, and the activities that drive those numbers. Then, you can focus on what needs to be improved or what’s going well.
For example, say you have a sales rep who is doing a great job on the number of calls and their target connect rate, but they’re setting up fewer meetings after those conversations than you would expect, based on their peers.
That’s when it’s up to you to understand how those conversations are going, as we discussed in step one.
Test and experiment
You can start to test and experiment, changing the pitch or the slides, for the next week or next ten conversations, and see if that moves the needle in a positive way. If it doesn’t, you can try something else.
The point is you can easily figure out where you need to optimize your performance and tweak from there so the goal stays achievable and within reach.
Bottom Line
Ultimately, a well-articulated and fully transparent sales metrics strategy can help your whole team work better together.
And by following the 6-step process outlined above, you can find the right sales metrics and KPIs — such as those listed above — and start moving the needle for your team today.