*Editors Note: Recap post of the Deck presented at Sales Hacker Series in Boston on November 18th, 2014 by Steve McKenzie, VP of Sales at InsightSquared. All of the data presented here is illustrative.
1. Lead Trajectory and MQL Growth
A lot of companies track leads, website visits or blog subscriptions, but the problem there is that it’s a lot easier to attract general traffic than it is to attract your target buyer.
- You may see a sharp increase in traffic, but if you don’t segment general visitors versus marketing qualified visitors you’ll have a misleading indicator of growth.
- Therefore, identify criteria to label something MQL and then track the growth of new MQLs month over month.
Are We Growing our MQL Number?
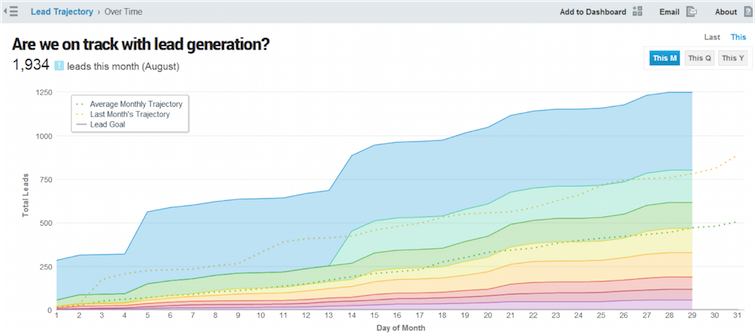
Here’s how we do it, the different colors in the charts represent different lead or campaign source for MQLs.
You want to watch for two things here:
- One is that you actually have exponential growth up and to the right.
- Two is that your mindful from where the lead growth comes from, this will help you double down on the right marketing spends later.
2. Lead to Opportunity Conversion Rate Over Time
Now that you’ve gotten marketing on track, you’ll need to pressure test whether or not your criteria for MQLs was correct. By tracking the percentage of MQLs that convert to sales opportunity month over month, you can early identify whether or not the leads you thought were marketing qualified are actually sales ready or not.
Where do Unqualified Leads Fall out of our Sales Funnel?
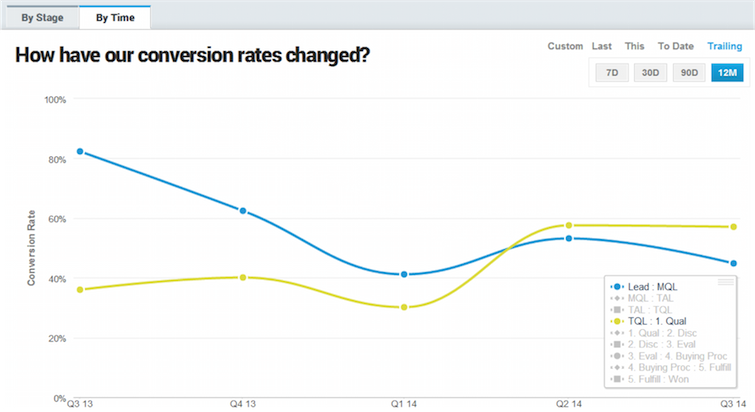
Take a look at this trending chart. Here we’re tracking the percentage of leads that get qualified as MQLs in blue, and MQLs that convert to qualified opportunities in yellow.
You’ll notice up until the end of Q4 in 2013, about 40% of our leads were classified as MQLs, by the end of Q2 that jumped to 80%. So either our marketing team got a lot better at attracting the right leads, or they loosened up their criteria on what qualified as an MQL.
The proof is in tracking the conversion from MQL to opportunity (that’s in yellow). What you’ll notice is that at the same time in Q4 last year and Q2 of this year, there was a drop from 80% to 20% lead-to-opp conversion rate. So this is how you keep your teams honest and don’t get a misleading indication of growth.
3. Call to Connect Ratio and Meeting to Deal Ratio
Now that you’ve got your marketing house in order and you’re able to maintain the integrity of their growth, it’s time to put in some metrics to ensure proper handling of those leads by your phone team. Too many companies rely strictly on dial counts or phone volume as the sole metrics for a phone prospecting team.
- It’s actually more important to be able to identify the actual ratios between the different steps in your sales process:
- Calls to connects
- Connects to meetings, ect.
This will allow you to develop a model that truly reflects the activity levels required to realize your growth goals.
Is My Sales Team Working the Phones Effectively?
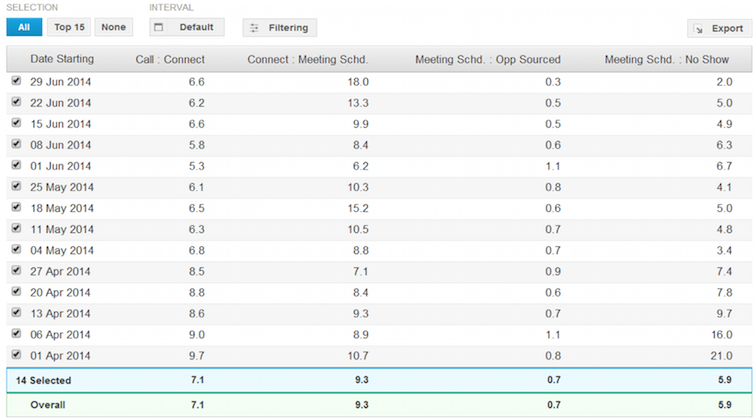
You know it takes about 8 calls to get a connect:
- For every 10 connects you get, you can book a meeting
- And 70% of those meetings show up and turn into opportunities.
- You can now do the math and know that you need 80 calls to get one meeting
- So you’ll need about 115 dials to get an opportunity.
- Now if you take into account the amount of pipeline your phone team is supposed to generate and multiply that number of opportunities by 115 dials, you can easily back out the number of calls your team needs to make in a day.
Questions that you’d normally slave over in Excel can become incredibly easy with this style of reporting:
- How many dials a day does a rep have to make
- How much head count do I need
- What’s a realistic expectation for Demand Generation in my business
4. Pipeline Inflow/ Outflow
You should have a demand gen side that’s reliably performing and generating pipeline. Unfortunately, the concept of trending pipeline reports and all CRMs fall way short of expectations. They can give you a snapshot of your pipeline today, but they can’t realistically tell you if that’s better or worse than this point last month or last quarter. How can you measure growth if you can’t see historical trends?
Are We Winning More Than We Lose?
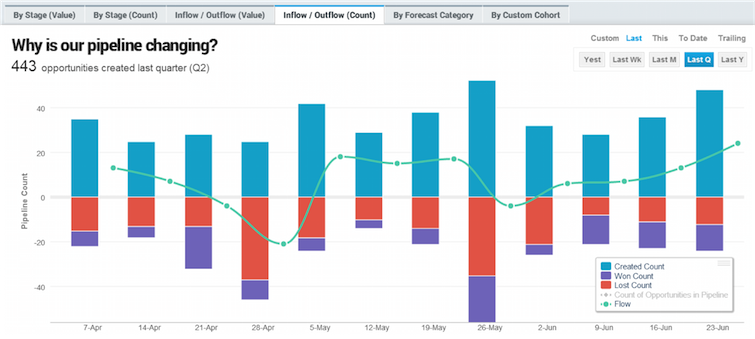
Here’s a solution to the inability to see trends:
- The blue bars represent pipeline being created in the given month
- We track it by value and by count separately
- It’s important for us to identify if we’re creating more opportunities than we used to while maintaining discipline that they’re not all turning into loses.
5. Analyze Your Bookings
That takes us to our final point:
- If you can generate growth on your marketing side
- Analyze the integrity of that growth by watching your conversion rates
- Model your phone activities to maximize the return on that lead growth
- Track to ensure positive pipeline growth, then you should see a growth in bookings. Otherwise there’s a sales execution problem.
Is Your Team Converting Opportunities into Deals?
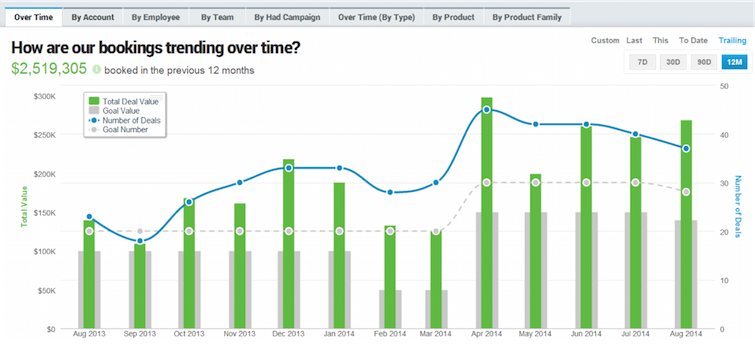
So here’s my favorite slide and you can probably tell why. You’ve invested in marketing and gotten a return, you’ve modeled and invested in your phone prospecting team and gotten a return, now you can see the final payout by looking at a bookings trend that goes up and to the right.
View the SlideDeck from Steve and his Presentation at Sales Hacker Series in Boston here:


