

Every CEO wants to squeeze more out of their investments in customer acquisition. And that’s particularly true in today’s market. Stock multiples have come down, especially for many business-to-business SaaS companies that are not yet profitable. In this environment it’s all about doing more with less, and hence we’re seeing the rise of the “moneyball” CEO. These smart leaders leverage predictive analytics to grow revenues with what’s already in their pipeline.
Before getting into how to identify this “whitespace” of untapped opportunities, let’s take a step back and think about what executives should be doing to drive revenue. If I were to encapsulate a go-to-market (GTM) manager’s key functions as an algorithm, it would look something like this (in pseudo-code):
Loop Until Fired():
- Forecast_The_Business()
- Identify_Gaps_In_Current_pipeline()
- Reassign_And_Enable()
Repeat
There are fairly established tools for the forecasting step — like Birst, Cloud9, Domo and GoodData — and the reassigning and enabling step is generally covered by proven approaches to training, hiring / firing, territory management, reallocating spend based on customer acquisition costs (CAC), etc. However the step of identifying specific gaps in the pipeline is the toughest to nail (especially when it’s late in the quarter), and it’s the defining the step that separates mediocre from amazing strategic leaders.
It’s time for this second GTM step to have a framework that’s just as repeatable as the other two, and we finally have proven data science to make that possible. Predictive analytics is a great way for any B2B company to mine their business funnel for deals that can close quickly, and identify potential revenue they might be leaving on the table. In fact, I’ve benchmarked several companies and found that they’re consistently sitting on pipeline which could add 10% of overall revenue from leads and contacts they already paid to acquire.
Identifying and Visualizing the Whitespace
There are three main layers where most businesses can identify whitespace: marketing, sales development, and account executive opportunities. Each of these can be visualized with the following dashboards and queries, which are based on metrics I’ve personally used to help my company attack our own whitespace.
Marketing
Any company that’s been selling for a while probably has a chunk of leads buried in some type of archive or so-called “nurturing” pile. While most people assume that old leads are worthless, they can actually be the fastest route to growth when the right prospects are activated, because these are contacts or accounts that already know something about your product.
To keep your finger on the pulse of this marketing whitespace, you can develop a dashboard that identifies good leads and monitors how long they’ve been sitting in a neglected status. You should challenge your marketing and sales folks on their follow ups, ask why these prospects are being ignored, monitor trends in their conversion rates, and build goals on these metrics. Here are some examples of specific queries you can run in your business intelligence tool (I’m using PowerBI here):
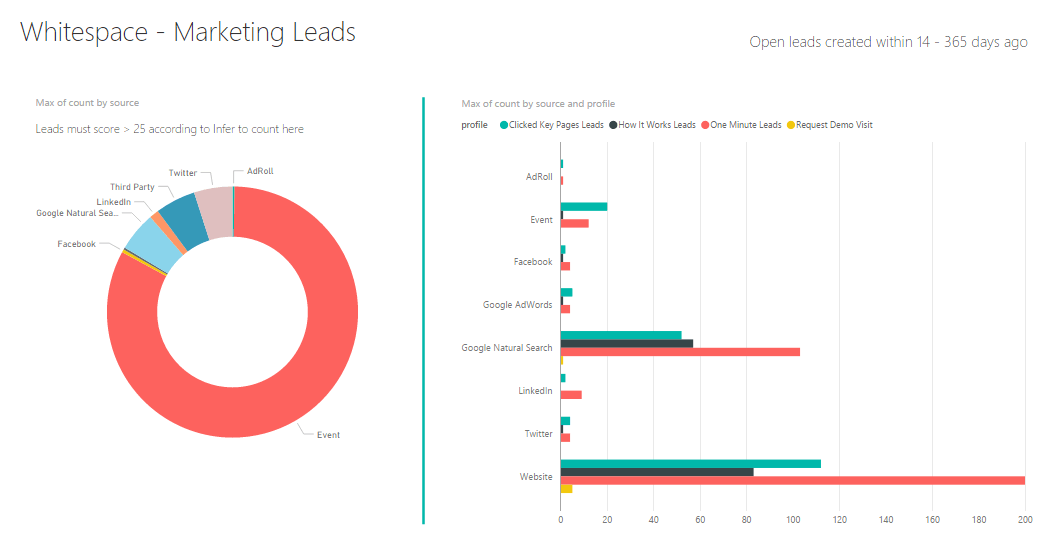
As you can see, you might find untapped opportunity in leads that meet criteria such as: 1) haven’t been touched in 14 days, 2) were created within the last year, 3) have high predictive scores, and 4) fall into a key profile like “clicked on key web pages” (pricing, customer stories, etc.). Here a CEO or GTM leader can see they have over 200 leads that came through their website and spent more than one minute reading through content. Say they know this session time results in an opportunity rate that’s 4X the average — these analytics show there’s gold sitting in nurture.
Sales Development
The next layer to analyze is inbound and outbound sales development, a function that’s key to going up market, implementing account-based marketing, and more. Outbound prospecting is like rifle shooting in that SDRs are trying to hit very precise targets. And on a CAC basis, it can often deliver a better return than marketing, despite increasing headcount. This is because of the level of personalization and focus SDRs are able to achieve, which can increase response rates from more qualified leads.
It can be very helpful to employ a profiling or segmentation tool that lets you slice and dice your target markets by key attributes – e.g. B2B companies with 50 or more employees that use Salesforce, companies based in Boston, companies with websites that include a public pricing page, etc. When reviewing each SDR’s accounts in this multi-dimensional way, you’ll find a bunch of areas that are ripe for more aggressive follow up, and can provide context into why and how they should target them.
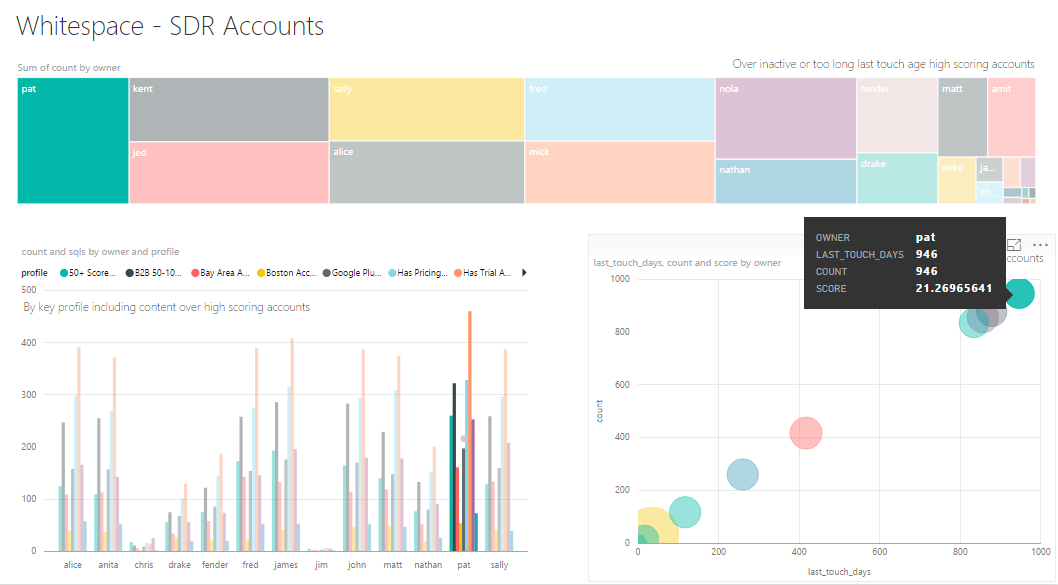
For example, these visualizations show that Pat, our top performer, has the most accounts assigned to him. Unfortunately, it seems we got carried away and gave him too many accounts, as he has many that haven’t been touched in some time (see how he leads the pack at the far left of the top treemap). We can also see that over Pat’s account set, his average last touch is way too long — 900+ days — so he’s ranked the lowest here (in our bottom right chart). And it looks like we’ve assigned him accounts in high converting profiles (check out his bars in the bottom left histogram) that are likely being neglected. It’s time to redistribute Pat’s accounts to ensure they get more love sooner.
Account Executive Opportunities
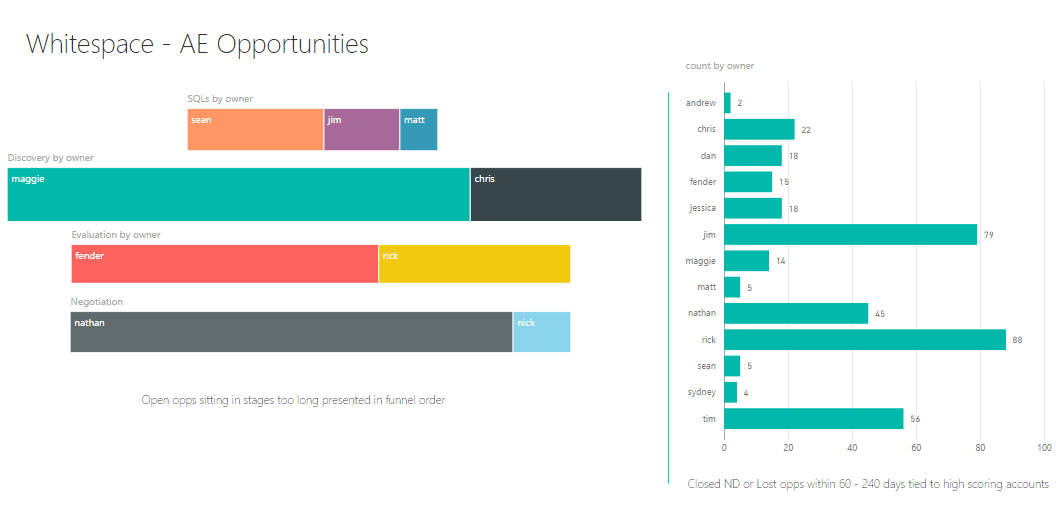
This next layer may seem odd, because you’d expect older AE opportunities and accounts to get pushed back to the SDR. But I’ve noticed that many accounts seem to stay assigned to the quota-carrying AEs for too long without receiving enough attention. This likely happens when an opportunity progressed to late stages and the rep built good relationships with champions during the sales cycle. However, during the middle and end of the quarter, AEs are focused on closing deals vs. lighting up old accounts to rebuild pipeline.
It’s important to identify whitespace here and figure out what should get assigned back to SDRs, and which opportunities AEs should follow up on more aggressively throughout the quarter. This means challenging your VPs and AEs on what they own, and getting them to think beyond just closing deals to hit their current number, so they also focus on next quarter. This kind of dashboard can help improve that accountability:
Tying it All Together
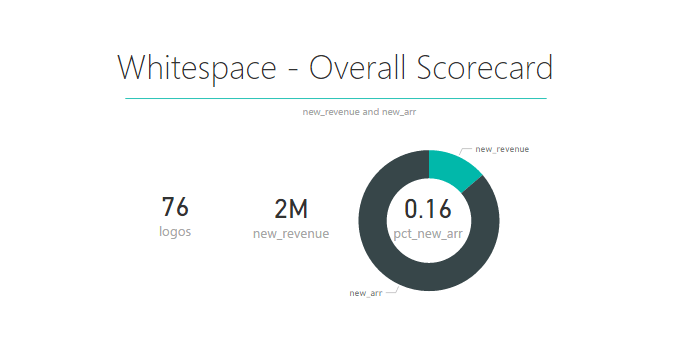
Let’s sum this up in one scorecard. You’ll want to add all the whitespace opportunities you found, apply their respective conversion rates (with a discount since they’re older deals). This will result in a forecast figure of how much revenue you can close — and it will very likely show that you can grow overall topline revenue by 10% with what you already have in your pipeline.
There are always gaps somewhere in the go-to-market process, and a methodical approach to filling those revenue gaps with new logos can reap big returns. Every CEO needs its own data mastermind like Jonah Hill’s role in the Moneyball movie. Capturing whitespace is the fastest way to get to profitability and separate from the pack – and the best approach is through analytics tailored to your business.


