

Getting an accurate sales forecast is almost as important as hitting the revenue target itself. But with so many different sales forecasting methods, how do you know which technique will give you the most accurate view?
According to CSO Insights, 60% of forecasted deals do not actually close. Unsurprisingly, the data also shows that 25% of sales managers are unhappy with their forecast accuracy. Choosing the right forecasting technique can make a huge difference in your ability to accurately predict future revenue.
In this post, I’ll discuss three sales forecasting methods that have proven to be effective for us at HubSpot. In fact, we’ve seen that a combination of all three has actually given us the most accurate predictions.
I’ll give a high-level overview of each method we use, but I also recommend you test and tweak them to fit within your own business model before rolling them out to your teams.
What Are The Three Kinds of Sales Forecasting Techniques?
Forecasting is based on a premise of data requirement and the application of the data in projecting future sales. A sales forecast can only be as good as the data it is based on. Forecasting specialists use three types of sales forecasting techniques in sales forecasting. The forecasting technique is based on the type of input data used in forecasting demand. The three sales forecasting techniques include:
- Qualitative techniques
- Time series analysis and projection
- Causal models
The qualitative technique uses qualitative data while time series analysis focuses on patterns and pattern changes. The causal model relies on highly refined and specific information regarding relationships between system elements.
The variance in the techniques implies that the same type of technique is not appropriate for forecasting sales.
For instance, the time series analysis that relies on historical data may not help forecast the future of a new product that has no history.
So what are the general functions of the three types of sales forecasting techniques?
#1. Qualitative Techniques
Qualitative techniques of sales forecasting models are used when there is limited data available. For example, you can use qualitative techniques when you introduce a new product in the market. There is limited data about the product to use in forecasting the future.
The techniques employ human judgment and rating schemes to use the qualitative information and turn it into quantitative estimates. The objective of the method is to bring together logically and systematically all the judgments and information regarding the factors being estimated.
You can use qualitative techniques where penetration rates and market acceptance of a product are uncertain. You can also use them in new technology areas where you require several inventions to develop a product.
There are five qualitative techniques which include:
Panel consensus
Panel consensus is the simplest technique to use and is mainly used by commercial organizations to forecast the future of their product. It is based on the premise that several experts can make a better forecast than one person in various fields. There is no secrecy in the technique, and communication is allowed between the experts.
Delphi method
The Delphi method is a revenue forecasting model that uses surveys and questionnaires to forecast future sales. The goal of the Delphi method is to forecast the probability of occurrence of events and the likely period of occurrence. Like the panel consensus technique, the Delphi method involves experts and a Delphi coordinator.
Salesforce composite technique
In the sales force composite technique, the company asks its sales personnel to make their forecasts. The assumption is that the sales reps are in direct contact with the customers and other parties in the distribution channel. As such, they can be better informed about the demand for a product.
Buyer’s expectations
In this sales forecasting technique, you survey buying intentions and market intents. If you want a survey of buying intentions, you select a sample of potential buyers and try to get information about their potential purchase of the product in the future. You then extrapolate the information to get the total demand forecast.
Market research
Market research is a conscious procedure of demand forecasting that involves systematic and formal processes. It involves testing hypotheses about the real market.
#2. Time Series Analysis
The Time Series analysis sales forecast technique is used when you have years of data available about a product or product line. You can also use it when you have clear trends and relationships about a product, and they are stable.
The forecaster uses the past data of the product’s performance to get the current performance rate and the change in rate. The acceleration or deceleration of the current rates comprises the basis of forecasting.
A time-series method is a set of chronological ordered points of raw data. A time-series analysis helps to explain:
- Trends in the data
- Cyclical performance patterns that repeat any two or three years
- Any systematic variation or regularity of data in different seasons
- Growth rates of various trends in data
#3. Causal Models
Causal sales forecasting models are developed when you have enough historical data regarding a product and analysis carried out. The analysis should show the factors you wish to forecast and other economic forces and social-economic factors.
If you want sophisticated sales forecasting models, you should use the causal model. It expresses the relevant causal relationship and can include market survey information and other considerations. The technique can also incorporate the results of a time series analysis.
It considers the dynamics of the flow system and uses predictions of related events such as promotions and strikes.
What Are The Sales Forecasting Methods?
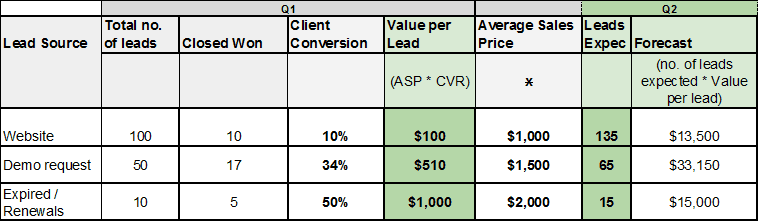
#1. The “Lead Value” Sales Forecasting Method
Concept: This forecast model involves analyzing historical sales data from each of your lead sources. Then, you can use those data points to create a forecast based on the value of each source.
The beginning of a buyer’s journey can tell us a lot about how that journey will end. It’s like a bad romantic comedy. If you’ve seen a few similar movies, you can usually predict how they will end based on a few early, telltale signs.
By assigning a value to each of your lead sources or types, you can get a better sense of the probability for each of those leads to turn into revenue.
For this model, you’ll need the following metrics:
- Leads per month for the previous time period
- Lead to customer conversion rate by lead source
- Average sales price by source
The Calculations:
Average sales price per lead
To get your average sales price by source you simply have to look at the data set for your entire customer database and bucket them by lead source.
For example, you may find that website leads close at an average of $1,000 per customer, while leads who request a demo close at $1,500 per customer.
If your CRM doesn’t have this reporting functionality, you can export the data into an excel file and quickly get the average sales price from there.
Average Lead Value
To calculate the lead value per source you multiply the average sales price by the average close rate for that source.
Average Lead Value = Average Sales Price * Conversion Rate from lead to customer
For example, if I know my leads from paid advertising spend an average of $2,000 with us and they convert at a rate of 10%, the lead value of each of those leads would be $200.
$2,000 x 10% = $200/lead
Total Number of Leads
To calculate the total number of leads needed in a given time-frame, divide your total revenue goal by your average lead value.
Leads Needed = Desired Revenue / Average Lead Value
Continuing from our example above, let’s assume our sales team needs to hit $100,000 in revenue next month. Since our average lead value is $200, that means we’ll need to generate 500 leads to hit our revenue goal.
100,000 / 200 = 500
Note, you should consult with your marketing team to learn what upcoming initiatives they have planned and where they expect lead flow to come from as lead values vary from channel to channel.
Once you’ve done that math in a spreadsheet, you’ll have something that looks like this:
Considerations:
While this is a great starting point, there are other factors that can alter your end results which must also be considered.
The average sales cycle may vary for each lead source. If you want to use this type of forecast, you should conduct an extra layer of analysis on time to purchase (or sales velocity) and factor it into your forecast.
Other business initiatives might change your conversion rates such as improvements in the sales process, price changes or discounts, etc. Look at a moving average of lead value for each source on a trailing 90 day period to stay current with other business changes.
Marketing may adapt their plans based on learnings or evolving trends. It’s important to stay aligned with them to ensure your expected lead volume and conversion rates are accurate.
Sometimes you may be unable to identify a single lead source. If that’s the case, you can bucket them as ‘other’ and include them in your forecast.
#2. The “Opportunity Creation” Sales Forecasting Method
Concept: This model helps you predict which opportunities are more likely to close based on demographic and behavioral data.
Let’s go back to our Romantic Comedy analogy. It’s often easy to predict what each character will do based on their appearance, and how they behave and interact with each other.
Predicting an opportunity’s likelihood to close is similar. By looking at demographic and behavioral data, we can get a better sense of the probability to close and the expected value of the deal.
The Calculations:
In this model, we look at the characteristics of businesses that have closed deals in the past. Then, we look for the same characteristics in our pool of potential customers.
To illustrate, let me take you through the way we implement this model at HubSpot.
We have found that the simplest way to evaluate an opportunity’s likelihood of closing is to look at the size of the business. For us, the number of employees and annual revenue of a prospect account are solid predictors of our success.
However, there are many other factors that can determine the fate of an opportunity. For example, the role of our contact within the decision-making process, behavioral patterns, and previous interactions with HubSpot all have an effect.
It’s also key to look at the historical data for your most ideal customers: not just those that close but also those that retain and become referrals. These are the types of companies you want to prioritize.
This second layer of analysis is called lead scoring. Usually, Sales and Marketing teams work together to define a lead scoring system and set it up.
At HubSpot, we score our leads between 1-100, with 100 being the best fit. We then group scored leads into buckets called “A, B, C, and D” for ease of use.
Once you have your scoring system in place you can calculate the estimated value of each opportunity in your pipeline.
Expected Value of Opportunity = Average Sale Price * Average Close Rate
Below is a simple forecast of expected value per opportunity based on lead score and company size, with an average sales price of $4,000. For this to work, you need to know the close rates for each of your lead buckets.
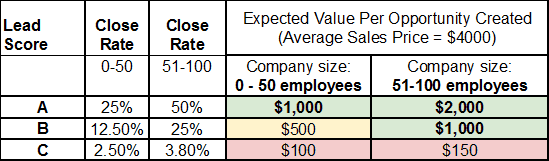
*marked with green = primary focus
**marked with orange = secondary focus
What I love about this model is that it shows the potential of each individual opportunity which helps my reps prioritize more important opportunities.
Considerations:
For this model to work you need to have well-defined criteria for opportunity creation. However, even with that in place, you’re relying on your sales reps to follow procedure and remain consistent in their administrative activities. So you’ll need to keep an eye on it.
You also have to build an opportunity scoring system or use a program that can automate the process, which can be costly and time-consuming.
Lastly, you need to be able to trust the data your opportunity scoring system uses to assign the score. I recommend testing the new system with one salesperson for a set amount of time before rolling it out to the whole team.
#3. The “Opportunity Stage” Sales Forecasting Method
Concept: Of all the sales forecasting methods in the world, this one is probably the most popular. This model predicts the probability of an opportunity to close based on where the prospect currently is in your sales process.
First, you need to know your average sales cycle. Then, if you have mapped out the stages of your sales process from high-level awareness to a closed deal, you can get a good sense for their likelihood to close within the current forecasting period.
Here’s an example of the deal stages you might use for your sales process and the probability associated with each one:
- Appointment Scheduled (20%)
- Qualified to Buy (40%)
- Presentation Delivered (60%)
- Contract Sent (90%)
- Closed Won (100% Won)
- Closed Lost (0% Lost)
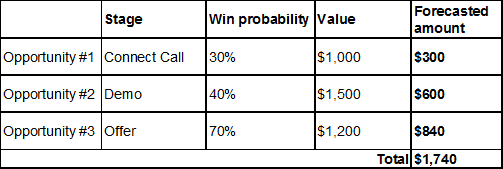
The Calculation:
In this model, you create your forecast for future sales by multiplying the amount of each opportunity by that opportunity’s probability of closing.
Expected Revenue = Deal Amount * Probability to Close
For this forecasting technique to work you will need a well-defined sales process with a detailed outline of the activities that need to happen in order to progress the deal forward towards closed won. Once you define your deal stages you then assign a probability to close for each one.
Below is a template you can use to map out your sales process. You can download an editable version here.
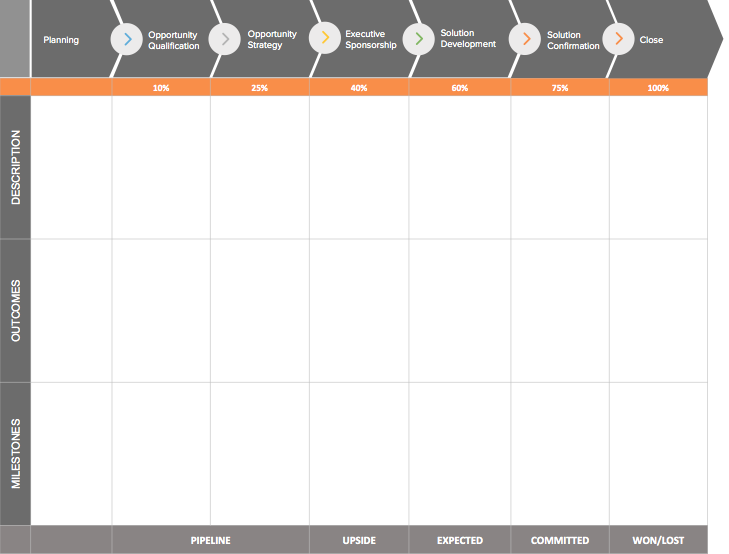
Here’s how this model should look:
For an accurate forecast, you’ll need a CRM system that allows you to automatically assign the win probability for each stage in the sales cycle.
It’s also a good idea to do a routine check every 6 months to see if your team’s performance is higher, lower or about the same as you anticipated when you initially set the probability. You should adjust the rates as your team becomes more productive and improves their conversion rate.
Considerations:
Old opportunities that have been sitting in your pipeline for months (maybe years) can affect the forecast. Make sure your data is fresh and the opportunities are updated regularly.
The probability factor is critical in this model so look at historical data and calculate it based on the performance of previous opportunities.
You need to have a very well-defined list of actions that need to happen before a deal can be moved into the next stage. Without clear guardrails over this part of the process, you lose accuracy.
#4. Length of Sale Cycle Forecasting
Concept: The length of the sales cycle forecasting method uses data about the time it takes a prospect to convert into a paying customer.
For example, if a sales cycle lasts for six months and your sales rep has been engaging a lead for three months, there is a 50% probability of closing the deal. Forecasting using this method is objective as it doesn’t depend on the emotions of your sales reps.
It is also advantageous as you can use it on a variety of sales cycle sources, so it is a perfect fit for companies that seriously track when customers join their sales pipeline.
Calculation:
To calculate the length of the sale cycle, you need first to decide the starting point. After that, use the following equation:
# of days from the first contact + customer conversion = # of days of combined sales
If you combine the total number of sales for the combined sales by the number of deals closed, you get the average length of the sales cycle for your organization.
Consideration:
Leads could include someone who downloaded an ebook from your website and then asked for a demo months later. As such, they create a second lead that triggers the initial contact with your sales reps.
#5. Intuitive Forecasting
Concept: Your sales guy would be the best person to ask whether the sale will happen or not.
Thus, you can ask your sales rep if they are confident of closing a deal and when. Your sales reps are the closest to your prospects, and they know how things are going. Therefore, the intuitive forecasting method relies upon your trust in the opinion of your prospects.
The most significant downside of the method is that it is subjective. If the sales reps are optimistic, they may provide high estimates, and there is no method to assess the figures.
Calculation:
No formal calculation here, but a sales rep will outline the dollar amount they expect to bring in a particular period with intuitive forecasting. For example, I plan to bring X number of dollars in X number of days.
Consideration:
The sales rep will examine the sales and outline the potential value of the sales. The sales rep should put all factors into consideration before giving the estimates.
#6. Test-Market Analysis Forecasting
Concept: Test-Market Analysis forecasting method enables you to roll your product or service to a particular group of individuals based on their needs. You can move the product to a specific location and see how it performs.
The results from the rollout can then be used to make a more accurate forecast of the future market. The method is ideal for big companies who wish to roll out a new product but want to test the market response.
Calculation:
In this method, you divide the market into two regions to roll out the product. The test market is where you bring the product to the market without advertising.
Then you have the control market where the product is advertised. The difference between the sales in the control market and test market is analyzed. The gap analysis helps forecast the future sales of the product.
Consideration:
The Test-Market method is a quantitative method that requires a considerable investment. It is ideal for launching new products or exploring new markets.
#7. Historical Forecasting
Concept: The historical forecasting method works by taking the previous sales data for a certain period and assuming that your sales will be better.
The problem with the historical forecasting method is it doesn’t put into account the dynamic market changes. For instance, if your competitors ran a promotional campaign, you may notice a decline in your sales.
Calculation:
For instance, if the monthly recurring revenue in June was $30,000. Using this method, you expect the MRR for July will be at least $30,000. Assuming your average year-on-year growth rate is 10%, your MRR for July should be $30,300.
Considerations:
While using the method, you should consider that the market is dynamic and prone to changes.
#8. Multivariable Analysis Forecasting
Concept: If you are looking for the most sophisticated and accurate forecasting method, multivariable analysis forecasting is an excellent pick.
It incorporates factors from other sales forecasting techniques, including opportunity stage forecasting, sales cycle length, and individual rep performance.
Calculation:
The multivariable analysis involves complex mathematics. You require clean data, and your sales reps should track the progress of the deal and activities, or your results will be inaccurate.
For example, you may have two reps working on the same account. The first rep has completed a demo with a prospect for a $20,000 deal. If the rep has a 25% chance of closing the deal, your forecasted amount is $5000. Assuming your second rep has a proposal of a small-sized deal of $8,000 and has a 65% chance of closing the deal, your forecasted amount is 5,200.
The total forecast for this account is: $5,000 + $5,200= $10,200
Considerations:
This forecasting method may be impractical for small businesses as it involves complex maths. Ensure your sales reps track all the deal progresses, or else your results will be inaccurate.
Sales Forecasting Using a CRM System
The table versions of these sales forecasting methods are ideal when you’re just starting out. However, if your organization is more established, the best thing you can do is to customize the reporting section in your CRM.
I’d love to hear how these models work for your business or if you’ve used other sales forecasting methods that have proven to be effective. Drop me a line in the comments below!


