

As sales leaders, your job is to help members of your team get to their sales goals by prioritizing the path that will get them there. Part 3 of this sales coaching series focuses on getting the prioritization right with your sales team.
There are a lot of possible ways to achieve a goal. Before that, here’s a story to help you understand why prioritization is key.
Different Reps, Different Approaches, Same Goals
Gary Rhoads is a co-founder of Xvoyant, a sales coaching technology platform. A leader in Brigham Young University Marriott School of Management, he’s a successful instructor and active advisor to many companies. He’s also a well-known leadership expert. His leadership course is one of the most popular curriculums at Brigham Young University. His altruistic nature landed him with a youth group as an advisor helping them hike to the “Y” on the mountain behind the University.

As they prepared for the hike, they told the group there would be a reward when they got to their goal. It became very evident that there were varied levels of fitness within the group. Gary quickly realized there were at least two approaches to successfully completing this challenge:
- A direct approach right to the top.
- A switchback-based approach for those not ready to go straight to the top.
To a few young people who approached Gary and said, “We can’t do it.”, Gary asked if he could show them a different route. He convinced them to give the other route a try and Gary started a switchback-based approach to hiking the Y.
At the first switchback, Gary had the team pause and instead of looking forward to the next challenge, he had them look back and congratulated them on just how high they had come.
After a quick drink, they pushed forward and came to the next switchback. When they paused this time one of the members of the group pointed out how far they’d come.
“That parking lot looks like a postage stamp!” one girl exclaimed.
They continued on and as you might expect, the entire team got to the objective. And did it faster than anyone had expected.
Outcomes vs. Process: What Do You Measure?
In part one of this series, several “mistaken identities” coming from a role perception challenge were identified. One was “The Closer” and the other was “The Pipeline Pusher.” Both of these identity disorders stem from a lack of understanding of the role or sales process as it relates to outcomes.
The pressure to hit goal is intense and real. There’s a reason the average tenure of a VP of Sales has fallen from 26 months to just 19 months over the last seven years! You’re allowed to have one bad year, but not two.
This pressure has led to an extreme emphasis on closing business on time and as forecast. Today, forecast accuracy is the #1 challenge identified by CSO Insights. As a result, it’s easy to understand why coaching is often confused with closing.
Great sales leaders know this simple fact: If your process is strong, success is inevitable. If your process is weak, success is unsustainable.
As a result, the most successful sales leaders spend their limited coaching cycles around process. This is the only way to create both predictability and sustainability to the sales function.
Measuring outcomes is easy. Sales is a lagging indicator and simple to measure. However, measuring process seems challenging at face value. If you understand how to quantify the key elements of the sales process, this can be done quickly and in a way that fuels predictive coaching conversations.
Sales Performance Coaching Metrics
With the sheer amount of volume and conversion data, it’s easy to have death by metrics. Too much data is dirty data.
You can find metrics to tell almost any story you want. While it’s true that great salespeople and great sales organizations run TO metrics and the average ones run FROM them, too many organizations have over complicated the sales processes!
The good news is you can simplify the sales reporting process to three key metrics and still have predictability and sustainability in your sales organization. These metrics include:
1) Dollar value of new opportunities in pipeline
Definition: The value of the opportunities in the pipeline.
Target formula: Sales Goal (Quota in $) / Win Rate
Why this matters: This provides a custom pipeline metric that accounts for individuality in both goals and win rate. You can’t close an opportunity if you haven’t started it first.
Example: If Jill has an annual goal of $1,000,000 and a win rate of 50%, then $1,000,000/.50 = $2,000,000 in target pipeline value in order to achieve goal.
2) Number of new opportunities in pipeline
Definition: The number of deals a rep is pursuing.
Target formula: Target dollar amount of Pipeline (item #1 above) / Rep’s Average Deal Size
Why this matters: This provides a custom “Deal Flow” metric that facilitates success based on a rep’s average performance levels. Helps avoid “Elephant Hunting” and builds consistency as well as predictability.
Example: Continuing the example from #1 above: If Jill has a $200,000 average deal size, then $2,000,000 / $200,000 = 10 deals in target pipeline deal flow in order to achieve goal.
3) Sales velocity
Definition: The time required to start and close an opportunity. Also referred to as “Length of Sales Cycle.”
Target formula: Measure the length of time of all won deals from start to close for total velocity metric. Also measure time by stage for all won deals.
Why this matters: Speed is the #1 predictor of wins and losses. Faster does not necessarily mean better. Poor sales skills usually destroys deals faster than time does. Too many reps skip steps in the name of speed. However, the velocity metric provides a custom “Deal Health” metric assuming the process is being followed. Speed by stage predicts advance rates, speed in cycle predicts wins and losses.
Example: Continuing the example from #1 above: If Jill’s optimal Sales Velocity is 90 days, and her current pipeline is averaging length of 63 days, this indicates a fresh pipeline. This metric is best used individually rather than as a combined average.
The formula for winning is simple: Start enough, with enough, fast enough.
This accounts for two competencies: Finding Opportunities, and Efficiency/Consistency in pursuing these opportunities, thus increasing win rate.
If you get these three sales performance metrics in the right place, 80-85% of your sales variability is under control. You’ll still see unplanned things happen, but this will flatten out the variance associated with your individual B2B sales engine.
Sales Performance Coaching Quadrants
By calculating the three predictive metrics for each rep, you can gain meaningful insight to the strengths and weaknesses of their sales process. By creating a 2×2 matrix, you can have powerful, insightful 1:1 conversations with each rep.
The up/down axis is a rep’s progress to goal. On the cross hair = hitting goal. Above the line = beating goal and below the line = missing goal.
The left/right axis is a rep’s skill in that part of the process. Each metric, opportunity starts in $, opportunity starts in # of deals, and sales cycle time can be plotted left or right of the axis depending on how ahead or behind the rep is.
This creates four quadrants:
1) Outcomes weak, Process weak: Deserved
Reps in this quadrant are right where they deserve to be. Until process becomes strong, the rep can’t expect to have more sales success. Depending on the process strength or weakness, a leader can work with a rep on very specific process points to get more finding success or efficiency success.
2) Outcomes weak, Process strong: Patient
Reps in this quadrant have established a sales rhythm that results in finding success and predictable efficiency. The rep needs to keep this rhythm steady. Once these opportunities are given a chance to complete the cycle, the rep will start to see successful outcomes.
3) Outcomes strong, Process weak: Lucky
Reps in this quadrant are hitting their goal, but they don’t have a sales prospecting process in place to have sustained success. Most of the time, this is a result of an unusually large win or two, or an exciting, but uncharacteristically high win rate. If a rep wins a deal or two that are 2-4x their normal deal size, this may not be sustainable.
If a rep has a month where they win 100% of their sales forecast, this is exciting but not necessarily a new normal if the average win rate for the rep is 32%. The rep needs to make focused efforts to improve process or run the risk of dropping to the Deserved category when the luck changes.
4) Outcomes strong, Process strong: Earned
These reps are not only hitting their goal, they have the process in place for continued success. The success they’ve had was not only predictable, it’s sustainable.
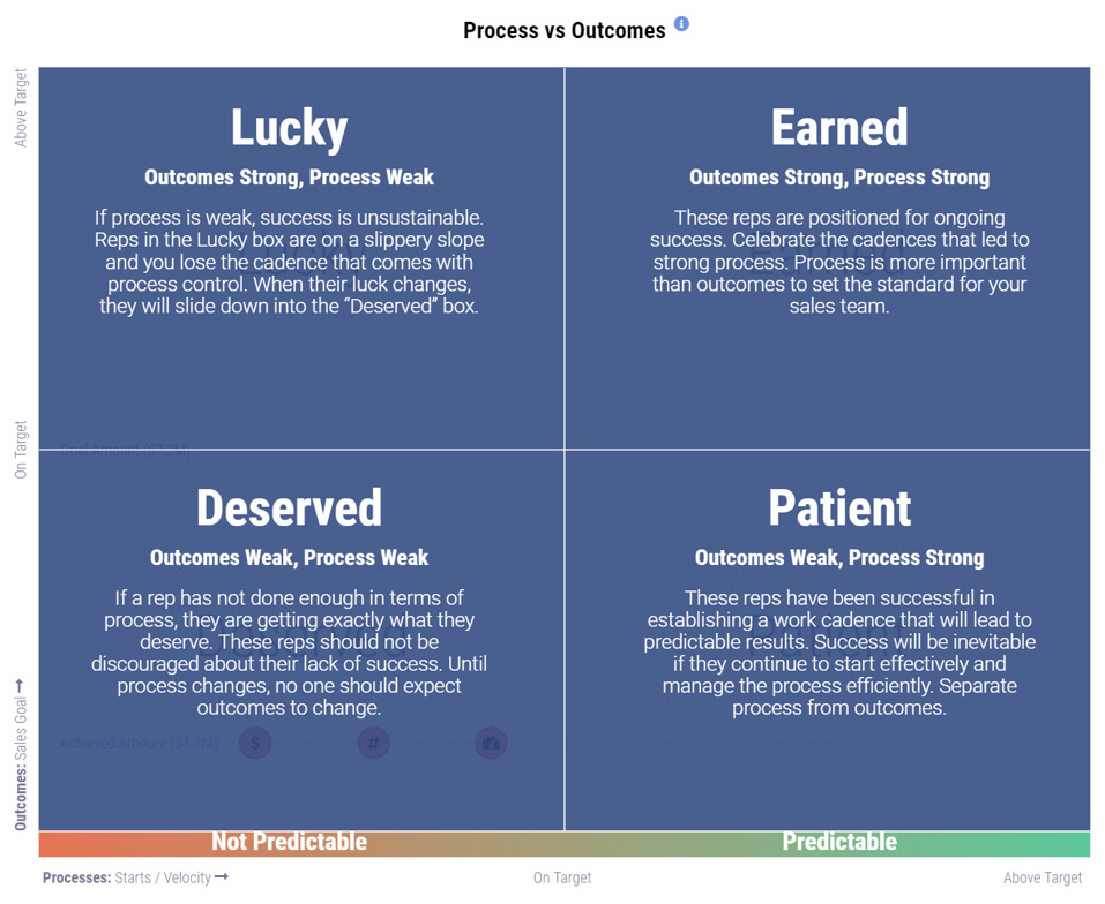
This chart is easy to use and helps a rep visualize how skillful they are in the sales process.
Most leaders and salespeople take an “Up vs. Down” mentality, a view where all that matters is being ahead of goal rather than behind goal. With this model, leaders and salespeople adopt a “Right vs. Left” mentality.
Related: Coaching Maturity Model: How to Take Your Coaching Culture from Good to Great
Salespeople should focus their efforts on being on the right side of the chart. This is where outcomes become predictable. Up vs. Down is a lagging indicator. This simply reports the past and does not indicate a data driven sales coaching approach. The right vs. left mentality is highly predictive.
Modeling Your 1:1 Coaching Conversation
This viewpoint removes defensiveness and emotion in the 1:1 coaching conversation. If the predictive process points are calculated to the individual level, a rep can have a forward-looking conversation without feeling picked on.
This becomes even more powerful if the salesperson knows that the basis of the coaching conversation will be around process points that drive outcomes.
By assigning specific activities and skills to each of the start enough, with enough and fast enough processes, coaching is simplified, and reps will never be caught off guard.
Too often, sales leaders have the difficult conversation with a rep they have a good relationship with, asking them to “Trust me….” or answer the “When have I ever let you down?” question when a rep is missing their number. With this approach, leaders can have powerful, non-emotional conversations with every rep on the team and understand how to prioritize the discussion points.
Let’s pretend Diana is a rep with the following metrics:
- YTD Sales Goal of $1,000,000
- Win Rate of 50%
- Average Deal Size of $200,000
- Sales Cycle time of 90 Days
- YTD Sales of $2,450,000
- New Opportunity Starts of $4,000,000
- Deals in Pipeline: 6
- Average Current Pipeline Age: 22 Days
How do you have a relevant, process-driven conversation with Diana?
1) Plot Target Outcomes and Actual Sales on the Coaching Quadrant
- YTD Sales Goal: $1,000,000
- YTD Actual Sales: $2,450,000
2) Calculate Target New Opportunity Starts in Dollar Value
- Target Starts($) = Goal / Win Rate
- Target Starts ($) = $1,000,000 / .5
- Target Starts ($) = $2,000,000
- Actual Starts ($) = $4,000,000
3) Calculate Target Opportunity Starts in # of Deals
- Target New Opportunity Starts (#) = Target New Opportunity Starts ($) / Average Deal Size
- Target New Opportunity Starts (#) = $2,000,000 / $200,000
- Target New Opportunity Starts (#) = 10
- Actual New Opportunity Starts (#) = 6
4) Plot Target Cycle Time and Average Age of Current Pipeline
- Average Cycle Time: 90 Days
- Average Age of Current Pipeline: 22 Days.
This is how Diana’s metrics plot to the Coaching Quadrant. She’s a high performing member of the team.
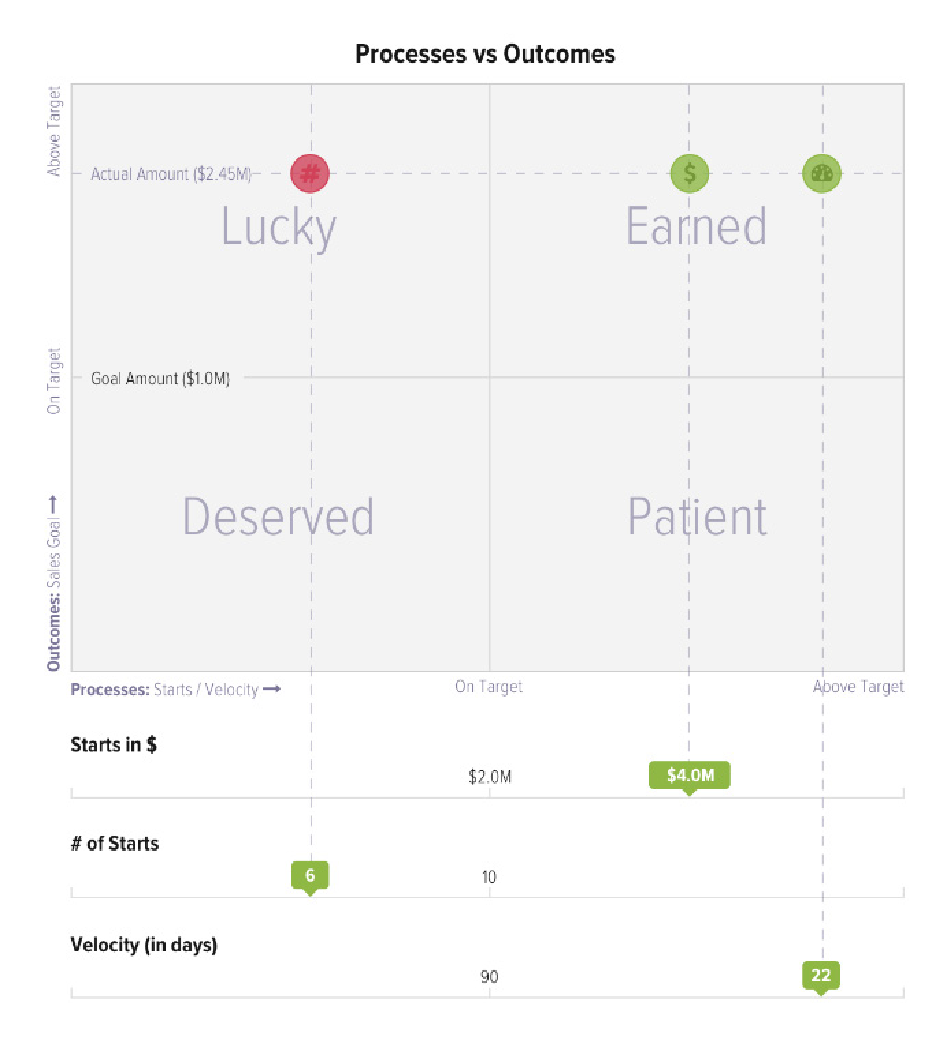
For many sales leaders, there’s a strong temptation to just leave the star performers alone. There is no doubt Diana is a strong performer. It’s clear the reason she is so far ahead of goal is because her finding efforts have been so strong and so sustained. However, there are ways you can be relevant to Diana and help her find the next stage in her development journey.
Sales Performance Coaching for Star Performers
The Coaching Quadrant helps a sales leader quickly determine how to be relevant to Diana and help her find “what’s next.” Here’s how:
- Diana is CRUSHING her goal. Closed more than double the company assigned YTD Quota.
- She has an exciting pipeline. Double the required pipeline coverage to continue to succeed.
- Her Pipeline is fresh at 22 days.
- She has only 6 opportunities in the mix and her deal flow metric requires 10. While this doesn’t mean she is a salesperson in trouble, it does provide some insights for you as a sales coach.
1) Coach for skills your rep may not have needed earlier
With Double the Pipeline $ on roughly half of the required # of opportunities, she’s clearly chasing opportunities significantly larger than she’s generally had success in pursuing. This may be part of a focused initiative with Diana to teach her to chase larger deals.
Given this, there may be dynamics related to the Decision Process for deals 2-4x larger than average that Diana should be aware of. This creates important coaching moments. For example, the way value is derived may be different in a large deal vs. smaller ones.
There may be more members of the decision team that need to be involved. Or there may be more administrative processes to navigate.
2) Keep a close watch on win rate
You have the benefit of understanding the organizational dynamics of large deals vs. smaller ones. It may be that cycle time and win rates change when you start chasing opportunities 3-4 times larger than Diana’s average. If win rates go down significantly, these opportunities could be a potential trap.
Helping her protect her 50% win rate by taking a closer interest in each stage, gaining key commitments, and obtaining customer verifiers will pay big dividends.
If you can help her learn to target and win deals of this size, while preserving a high win rate, she will have established a new normal and this Star performer now has created a new capability that makes her a Super Star.
3) Encourage activity based selling
Diana is actually at risk to run out of fuel faster than expected. The coaching calculators call for 10 pursuits in Diana’s case. She currently only has 6 deals. This is just a great coaching opportunity to show she may run out of fuel in her sales engine 40% faster than what normally might happen.
This provides a great way to have a time-blocking conversation to make sure she continues to prospect effectively.
The complexities of these large deals can easily be allowed to consume all of her time. This an opportunity for you to make specific coaching goals around sales activities.
Using the Quadrant to Set Personalized Goals
In part 2 of this series we introduce the importance of using your sales data to segment your reps. Armed with an understanding of the areas of the sales performance coaching process a rep might stand to benefit from, you can prioritize the focus points for a salesperson to help get to their goal.
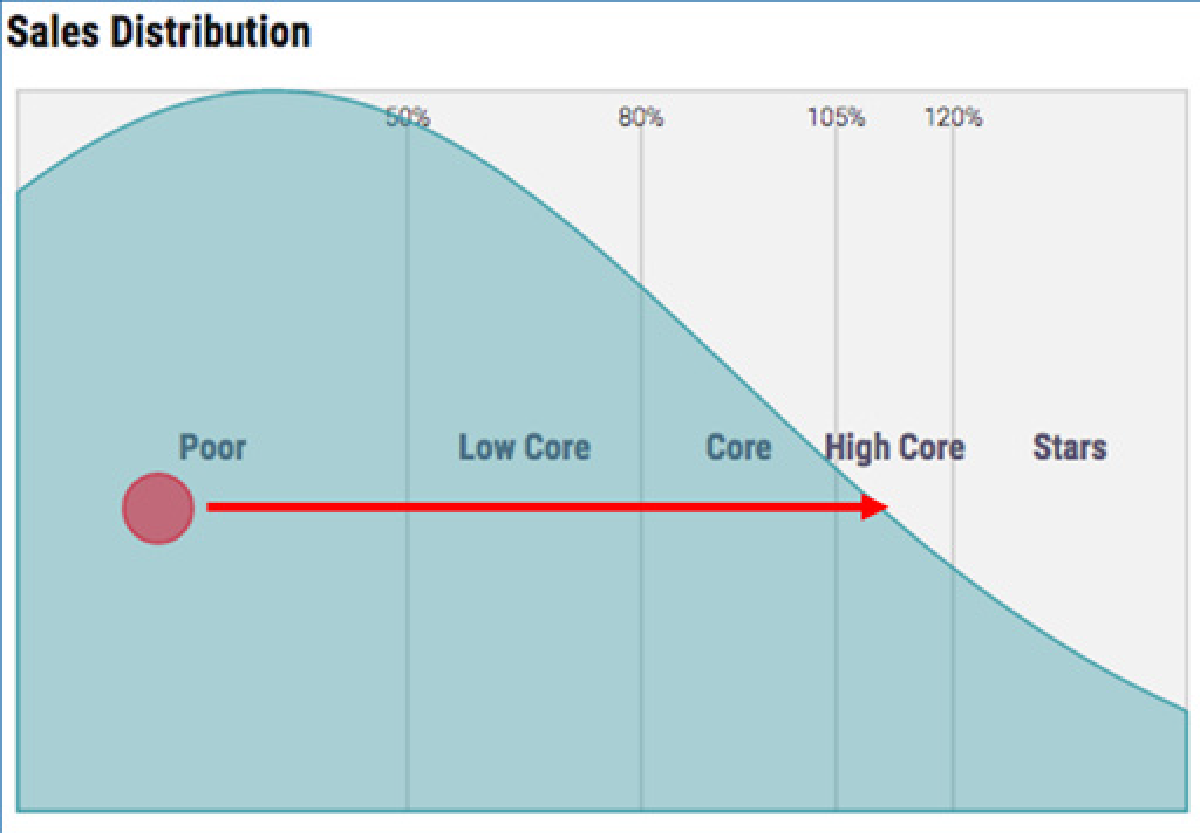
For example, let’s pretend David is a member of your team. He’s currently in the “Poor” category of the performance curve. David identifies that he wants to achieve “High Core” status this year.
We already have some insights to his process by using the coaching quadrant. You can now find a way to pick the right switchback path to help David finish in the desired destination: High Core.
Setting Target Activities Based on Individual Goals
Volume metrics track the key activities in your sales process. These are often tracked in your CRM tool. Unfortunately, most teams use these to stack rank and for gamification purposes.
Since we know David’s definition of success is to be in the High Core, it’s important to compare his activity levels to the activity levels of someone in the High Core. Stack Ranking becomes unimportant and gamification will only serve to provide artificial motivation.
You need to first identify what the activity plan of a High Core salesperson looks like in order to best help David.
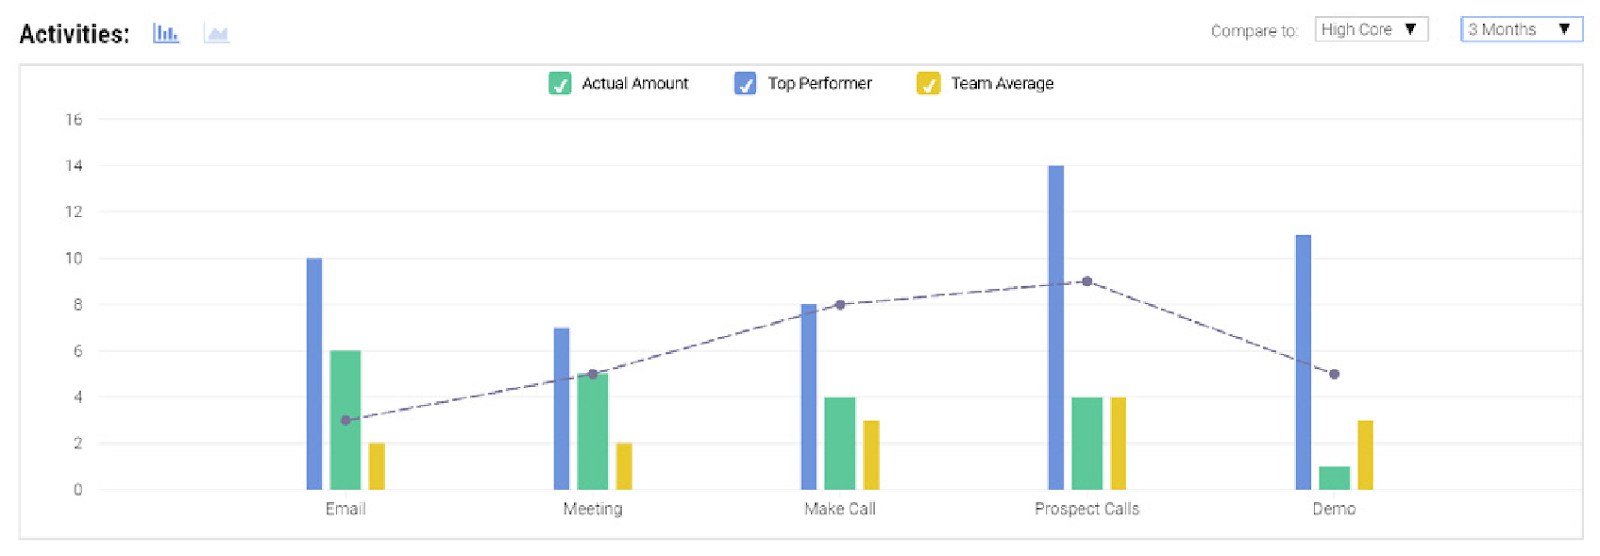
This chart compares David’s activity mix to the target performance mix (High Core) over the past 90 days. This provides some interesting insights:
- David is sending too many emails.
- David is generating the right number of meetings.
- David is not making enough calls, targeting enough prospects or generating enough demos.
It would seem that David needs a little direction on how to target his sales meetings differently so these meetings yield better results. Since he is in the poor category, we know his meetings aren’t moving the needle. Some of the sales coaching areas might include:
- Targeting
- Creation of value
- Prospect research
- Question preparation
- Follow up
Measuring Effectiveness with the Compound Growth Formula
If your first goal was to help pick the right target activities, now comes measuring the effectiveness of each of these activities.
There is a time-tested equation for creating new sales in any company. The equation has been proven by many groups, and given different names by different people. Unfortunately, this simple approach is underutilized by sales leaders and salespeople alike.
The equation is simple:
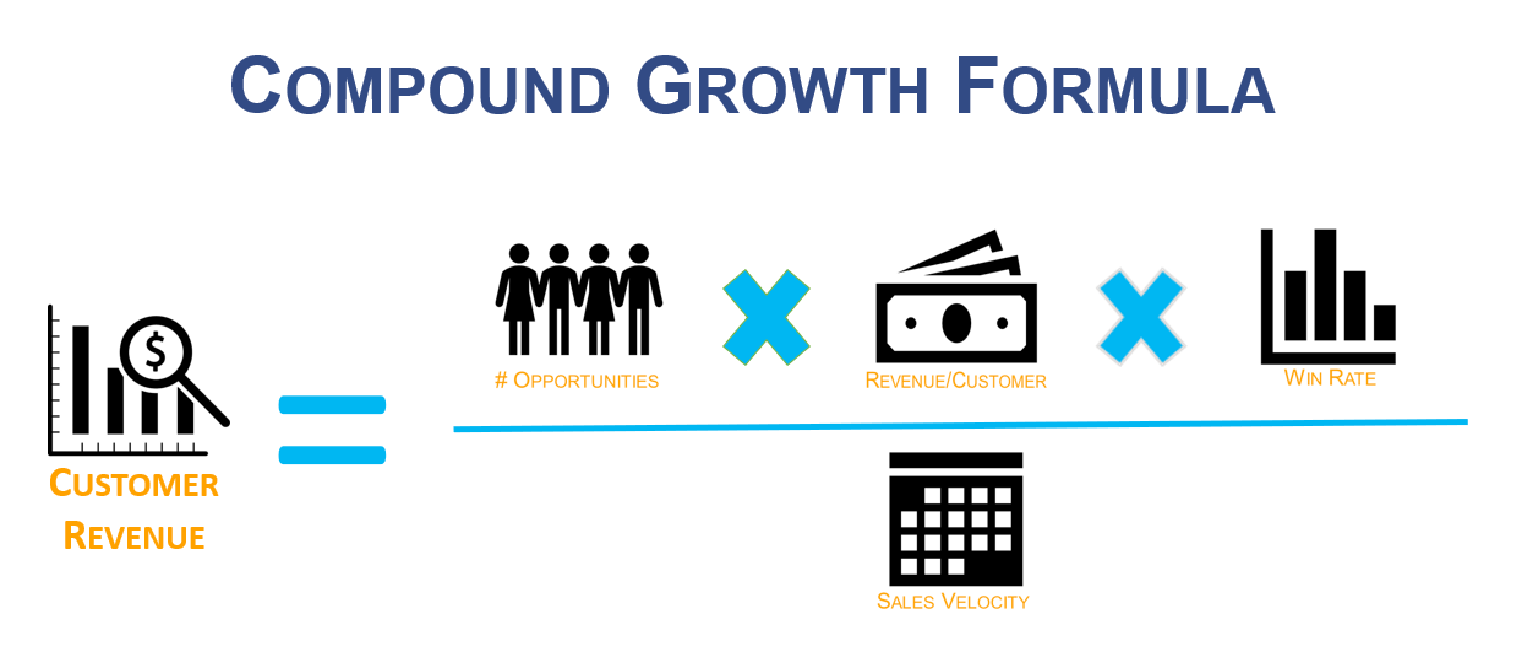
I refer to this as the “Compound Growth Formula.” For a salesperson, these are the drivers that can create a multiplier effect.
This helps simplify the revenue generation and coaching process if it’s operationalized.
Get the top side of the equation as big as you can and the bottom part as small as you can. As you evaluate this equation, every activity you ask your salespeople to complete can fall into one of these four categories:
1) Start new opportunities
Does the activity help identify a new opportunity from a new prospect or an existing customer? Are we expanding the customer base or expanding existing relationships?
2) Revenue per customer
Does the activity help a salesperson increase deal size or sell more products per customer? Are we solving more problems? Are we creating more value?
3) Win consistently
Each rep needs to know their personal win rate. This win rate is measured from start to close as well as advance rate by stage. Erratic win rates generally indicate poor process. Are the activities a rep engages in creating well-defined customer verifiers that predict outcomes? Customer verifiers are the top predictor of win rate consistency.
4) Complete Cycles fast enough
Time kills deals. This is not always the case. Faster doesn’t necessarily mean better.
Bad salesmanship has killed more deals than time ever has. As a result, tracking speed by stage as well as total cycle time is very insightful. Speed needs to be consistent. Inconsistency in cycle time generally indicates poor process.
Is the rep able to take the customer on an experience-driven journey where you have a general understanding of how long it should take?
Armed with the four competencies driving compound growth, you can now work with David to identify the Target Competencies required to be a “High Core” performer based on the activity mix of the High Core.
You should be tracking:
- Number of new opportunities
- Revenue per customer
- Win Rate
- Speed
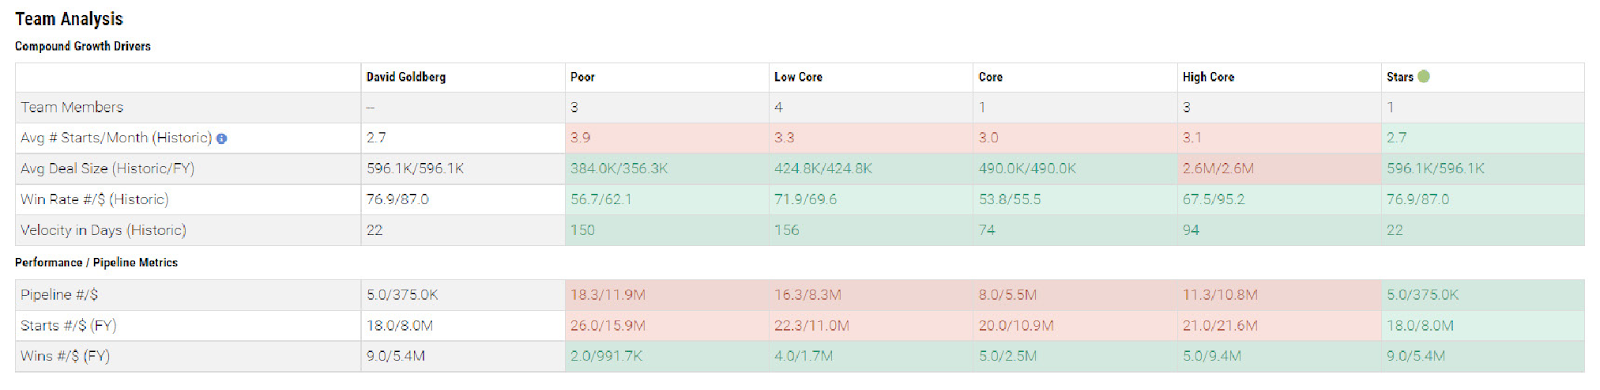
By referring to David’s definition of High Core, you and David can quickly determine the skills to work on as part of the sales performance coaching activities:
- David starts enough opportunities relative to the High Core
- Members of the High Core get 84% more revenue per opportunity than David’s do.
- David wins 50% of the deals he chases, but only 22% of the dollars in his pipeline. He’s only winning the small deals. By comparison, the High Core wins 17% more often and loses only the small deals.
- David’s cycle time is 103 days. The High Core completes deals in 94 days.
Target Competencies measure how effectively a salesperson completes the Target Activities. This sets the stage for the salesperson to choose which discipline to attack first.
How You Can Then Predict Impact
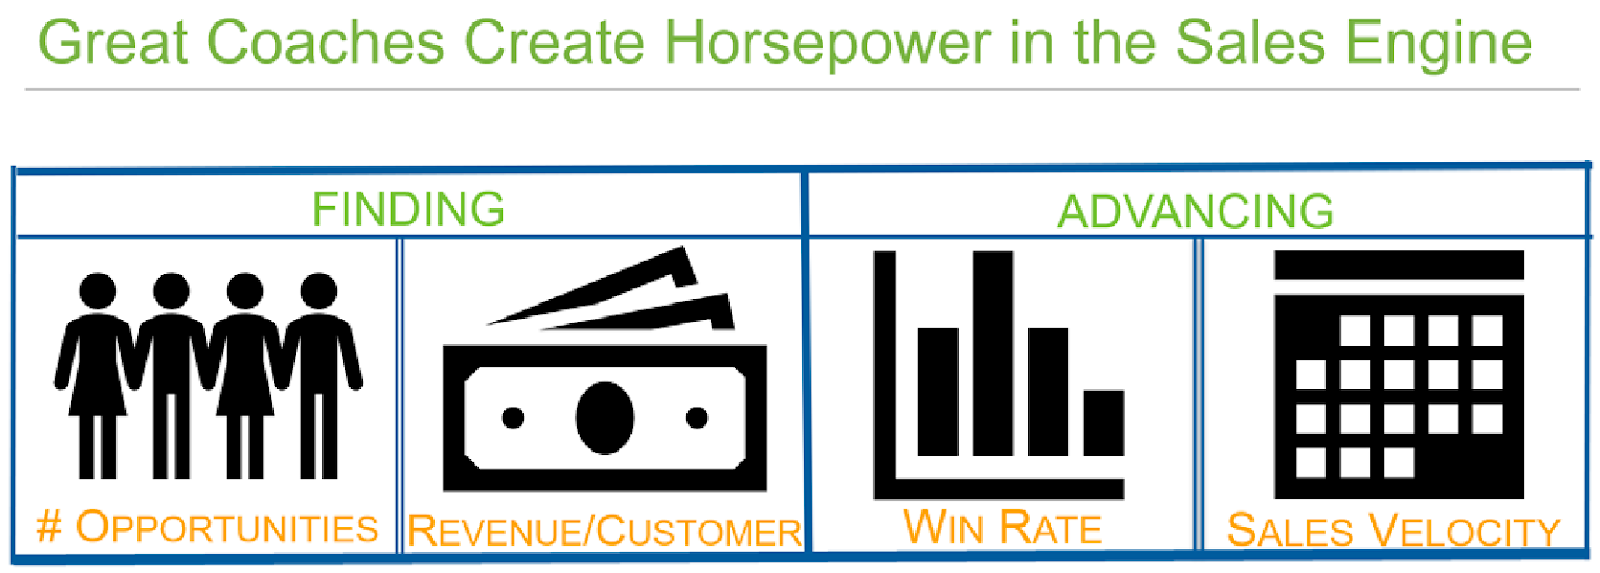
Your job as a sales coach is to create a high-performance engine with each salesperson.
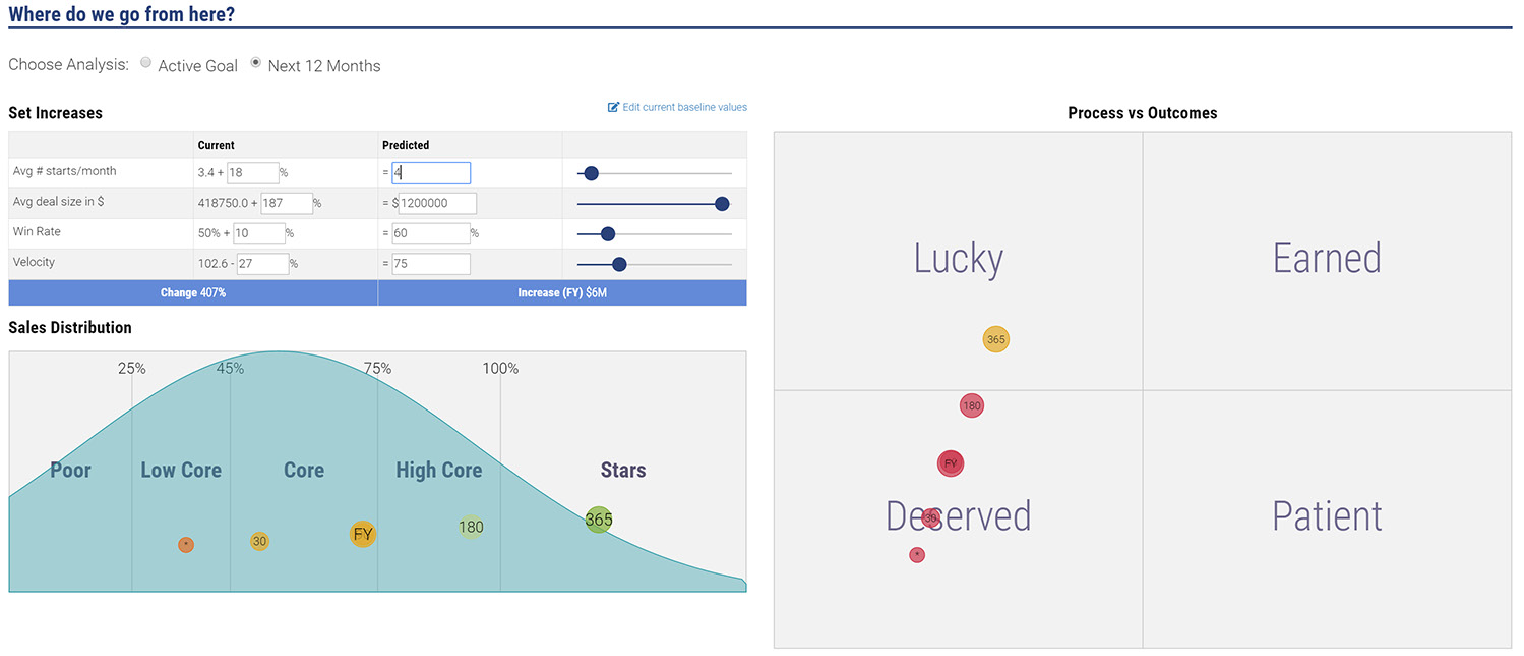
By combining the process/outcomes coaching quadrant with the Compound Growth Formula, a sales team can look at the sources of your high-performance engine like this:
By using the Compound Growth Formula, you can collaborate with the salesperson to pick the path that yields the outcome the salesperson wants. For example, if a salesperson was to improve their compound growth drivers by 10%, a scenario like this might exist:
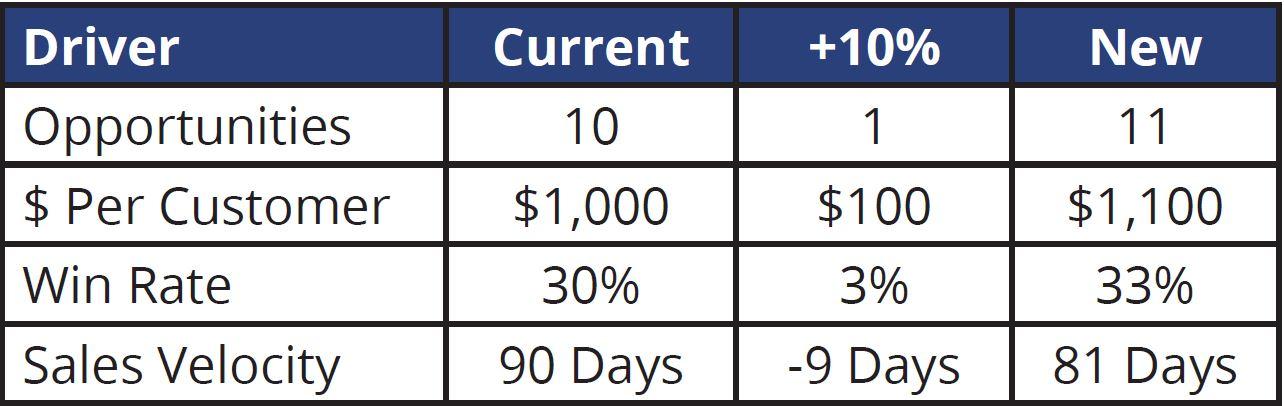
You can set very specific goals to change activities or develop new skills to achieve these end results. None of them look particularly challenging as a stand-alone goal. However, the compound effect is impressive. Consider the impact of 10% improvement over the course of a year:
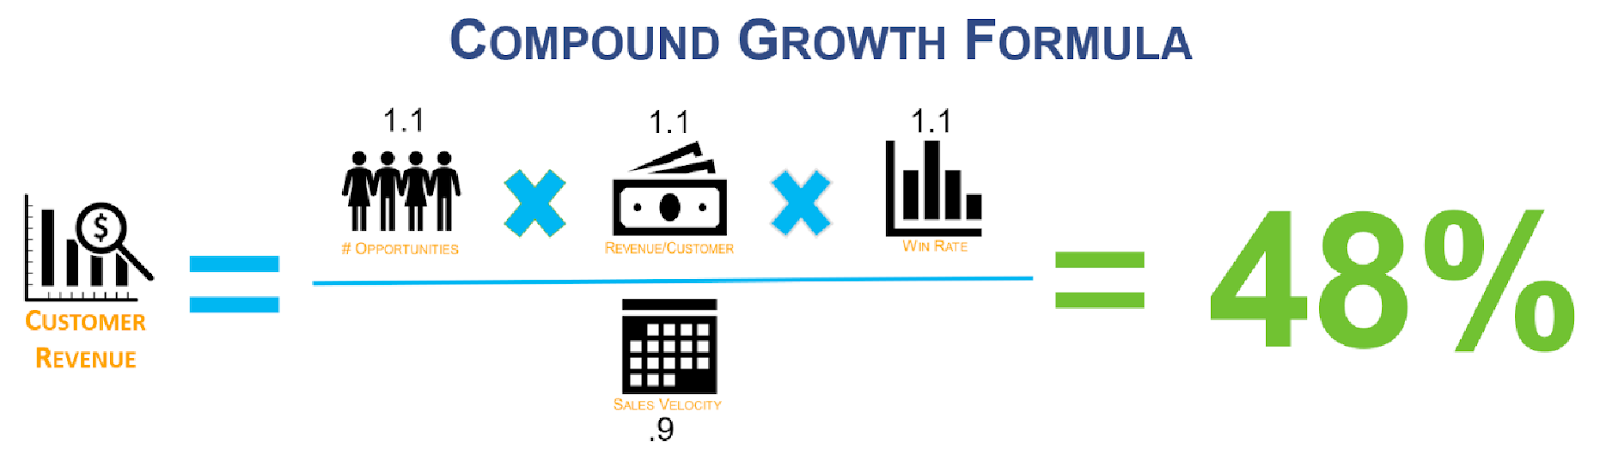
Try the math: (1.1 x 1.1 x 1.1) / .9 = 1.4788.
Improve the four drivers of your sales engine 10% better and you’ll grow by about half. This is a fantastic way to prioritize how to pick David’ path to the summit of High Core. By applying these percentages to the pipeline and closing dollars, you can quickly convert percentages to dollars.
By quickly determining which changes create the most impact, you can guide the salesperson through a process that will yield predictable outcomes.
“So what?”
Effectively prioritizing the path answers the most important question a leader can answer while coaching:
“So what?”
“What happens if I change?”
“What happens if I stay the same?”
“Because I said so” doesn’t work very well in getting my 10 year-old son to change behavior, and this strategy is even less effective with professional salespeople.
What works is prioritizing target activities based on target competencies. For every single sales rep. This sets the stage for creating the most important moments a coach can create.
We go into this topic in part 4 of this sales coaching series.
Other Guides in the How To Approach Sales Coaching Like a Pro Series
This is part 3 of a 5-part series on sales coaching models. Don’t miss the other guides in the series:


